Ho hum just another 70k cases and almost 1500 goners.
Maybe I’m misunderstanding things but it seems like the deaths have gotten higher a lot sooner than almost all the predictions ITT. which is pretty shocking. Like we’re already averaging 1,500 dead a day.
Everyone in this thread is too optimistic?
What? Most people were predicting much higher death tolls by now.
Nah from what I remember most people weren’t predicting 1,500 dead a day till mid august. Who had higher death tolls?
Ugh, so sorry you’re dealing with this.
5 Likes
I’ve been saying 1500/day by late July/early August and hitting 2k in another week or two and then up to 2500 then 3k over the next month after.
We may get lucky with the mask compliance going up, but now schools are opening so the masks are delaying the inevitable unless schools close everywhere that’s a hot spot (most places)
I don’t really keep track of who’s saying what, but I don’t recall the conventional wisdom being <2k/day by August.
I don’t know that anyone was super specific about their predictions, particularly single-day predictions, but here’s how I have thought about it. The best prediction of forward-looking deaths is recent cases*recent estimated CFR. (Recent cases are 7 day average and recent CFR is 7 day average deaths divided by 7 day average cases from 21 days ago). That gives me an estimated forward-looking death pattern that looks like this (blue line is high estimate and maroon line is low estimate):
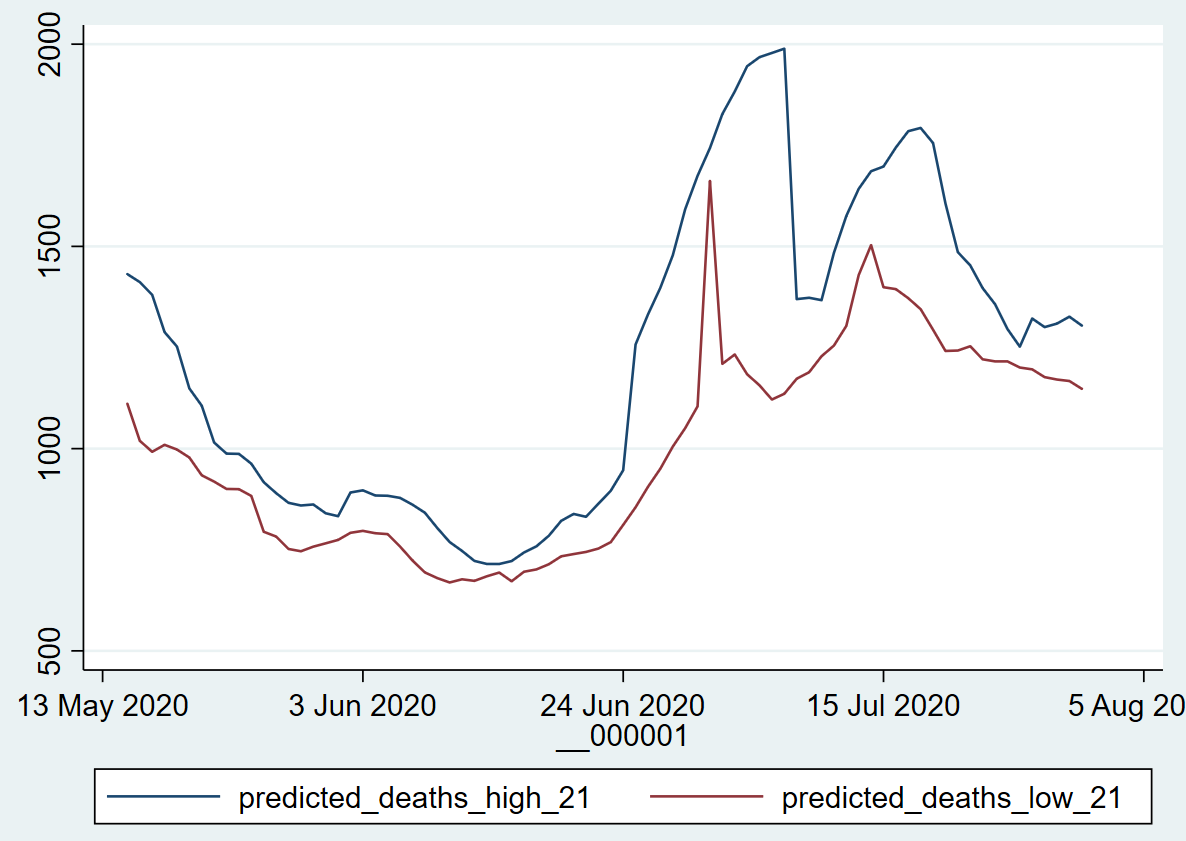
This is kind of a weird plot to look at, but basically it’s saying, “As of a given date, what is the high and low estimate for what 7-day average deaths will be roughly 3 weeks in the future?” So the estimate for today’s death count would look back to July 10th or so, and would say roughly 1,230-1,370 for the 7day average as of today. That’s actually a little higher than current 7-day average of 1,109 (I think that’s what it is right now. I’ve had a few beers.)
My estimate for the peak is that the highest 7-day average deaths will be between 1,350-1,790 and will be somewhere around the 7 days from 8/2-8/8.
Obviously(?) this is a fairly near term estimate and doesn’t account for the obviously-important fact that schools are starting up again in August.
2 Likes
From the DC Data Modeler, whoever that is.
1 Like
And macaques! So when humans all die of the COVID, Earth will be ruled by either monkeys on horseback or mice.
4 Likes
inshallah
3 Likes
| State | Pos% | Pos Cases 7DMA | 7DMA deaths 7.17 | 7DMA 7/27 | 7DMA 8/3 | 7DMA 8/10 | 7DMA 8/17 | 7DAM 8/17 w/floor 2% CFR |
|---|---|---|---|---|---|---|---|---|
| Alabama | 16.64% | 1732 | 25 | 37 | 49 | 60 | 72 | 72 |
| Alaska | 1.78% | 58 | 1 | 1 | 1 | 0 | 0 | 1 |
| Arizona | 23.96% | 3249 | 75 | 105 | 135 | 165 | 195 | 195 |
| Arkansas | 13.61% | 722 | 6 | 11 | 15 | 20 | 25 | 25 |
| California | 7.30% | 8309 | 95 | 109 | 123 | 137 | 152 | 166 |
| Colorado | 6.73% | 434 | 7 | 7 | 7 | 7 | 7 | 9 |
| Connecticut | 0.79% | 75 | 7 | 5 | 4 | 2 | 0 | 2 |
| Delaware | 4.10% | 72 | 2 | 2 | 1 | 1 | 1 | 1 |
| District of Columbia | 1.62% | 55 | 2 | 2 | 1 | 1 | 0 | 1 |
| Florida | 18.77% | 11057 | 102 | 206 | 310 | 415 | 519 | 519 |
| Georgia | 15.49% | 3421 | 25 | 52 | 79 | 106 | 132 | 132 |
| Hawaii | 1.84% | 27 | 1 | 1 | 1 | 0 | 0 | 1 |
| Idaho | 14.08% | 497 | 2 | 6 | 10 | 14 | 17 | 17 |
| Illinois | 3.07% | 1039 | 20 | 17 | 14 | 11 | 8 | 21 |
| Indiana | 8.49% | 615 | 15 | 15 | 14 | 14 | 13 | 13 |
| Iowa | 9.23% | 541 | 6 | 8 | 9 | 11 | 12 | 12 |
| Kansas | 10.73% | 474 | 2 | 5 | 7 | 10 | 13 | 13 |
| Kentucky | 6.37% | 394 | 7 | 7 | 7 | 6 | 6 | 8 |
| Louisiana | 10.32% | 1997 | 18 | 26 | 35 | 43 | 52 | 52 |
| Maine | 0.79% | 16 | 1 | 1 | 1 | 0 | 0 | 0 |
| Maryland | 5.40% | 602 | 9 | 9 | 9 | 8 | 8 | 12 |
| Massachusetts | 2.40% | 249 | 20 | 15 | 11 | 6 | 1 | 5 |
| Michigan | 2.60% | 623 | 9 | 8 | 7 | 5 | 4 | 12 |
| Minnesota | 4.26% | 602 | 7 | 7 | 7 | 7 | 6 | 12 |
| Mississippi | 13.48% | 887 | 17 | 20 | 23 | 27 | 30 | 30 |
| Missouri | 5.97% | 644 | 9 | 9 | 9 | 9 | 10 | 13 |
| Montana | 4.18% | 107 | 1 | 1 | 1 | 1 | 1 | 2 |
| Nebraska | 6.14% | 222 | 2 | 2 | 3 | 3 | 3 | 4 |
| Nevada | 15.13% | 869 | 8 | 14 | 20 | 27 | 33 | 33 |
| New Hampshire | 1.85% | 23 | 2 | 2 | 1 | 1 | 0 | 0 |
| New Jersey | 1.36% | 320 | 20 | 15 | 11 | 6 | 1 | 6 |
| New Mexico | 3.99% | 261 | 4 | 4 | 3 | 3 | 3 | 5 |
| New York | 1.14% | 410 | 10 | 8 | 6 | 3 | 1 | 8 |
| North Carolina | 7.43% | 1994 | 19 | 24 | 28 | 33 | 37 | 40 |
| North Dakota | 5.54% | 100 | 1 | 1 | 1 | 1 | 1 | 2 |
| Ohio | 6.20% | 1304 | 15 | 16 | 18 | 19 | 20 | 26 |
| Oklahoma | 9.37% | 639 | 4 | 7 | 9 | 12 | 15 | 15 |
| Oregon | 6.81% | 323 | 4 | 4 | 5 | 5 | 6 | 6 |
| Pennsylvania | 5.40% | 797 | 15 | 14 | 13 | 12 | 11 | 16 |
| Rhode Island | 3.46% | 62 | 2 | 2 | 1 | 1 | 1 | 1 |
| South Carolina | 18.49% | 1905 | 25 | 41 | 57 | 72 | 88 | 88 |
| South Dakota | 5.60% | 59 | 1 | 1 | 1 | 1 | 1 | 1 |
| Tennessee | 8.91% | 1868 | 15 | 22 | 28 | 35 | 42 | 42 |
| Texas | 16.12% | 8829 | 108 | 170 | 232 | 294 | 356 | 356 |
| Utah | 8.93% | 598 | 4 | 6 | 9 | 11 | 13 | 13 |
| Vermont | 0.94% | 9 | 0 | 0 | 0 | 0 | 0 | 0 |
| Virginia | 5.75% | 920 | 10 | 11 | 12 | 12 | 13 | 18 |
| Washington | 5.90% | 729 | 2 | 4 | 6 | 9 | 11 | 15 |
| West Virginia | 3.54% | 121 | 1 | 1 | 1 | 1 | 1 | 2 |
| Wisconsin | 7.15% | 827 | 4 | 7 | 9 | 12 | 15 | 17 |
| Wyoming | 4.81% | 35 | 0 | 0 | 0 | 0 | 0 | 1 |
| USA Totals | 767 | 1064 | 1362 | 1659 | 1957 | 2063 |
I did something similar but I used 4 weeks instead of 3. And I did it by state trying to factor in positivity rate.
WELL HOW DID THIS UNEXPECTED THING HAPPEN
3 Likes
Ok I guess Fox Memphis isn’t super with it with the previews but schools are facing wait for it Covid cases already
my question is why are schools in mississippi open in july? is that normal or are they trying something different. I assume AC was just implemented in that shit hole.
I thought people were predicting like 3k to 4k daily deaths by June at one point.
1 Like
I’m in for 2k the week of the 12th.
So Brian Williams just led with “some models are predicted 180,000 total deaths by the end of August.
Let’s see we at over 150K and already averaging over 1k per day and still going up and certainly peaking above 1.5k if not 2k/day.
Oh and August has 31 effin days.
What other than the cubic model* would predict less than 180K? That’s a minimum is preposterously unlikely to be that low.
*the cubic model likely predicts resurrection of several people already dead.
3 Likes
i forget if awval said trump needed to kill 300k americans or 350k americans to lose his support, but it might come down to the wire.
hmmm hang on tho, trump is saying the biggest middle class tax cut of all time is right around the corner, and isn’t this virus thing over anyway? stocks are good.
6 Likes