COVID-19: Chapter 6 - ThanksGRAVING

First 25 minutes of Maddow tonight is a must watch. Probably not online yet, but will be available as a podcast later tonight and msmbc will probably put up a vid. She discusses the craziness with herd immunity idea, the nutty cdc spokesperson, and the good dr Atlas, late of the Hoover Institution.

2 Likes

The fuck is happening?

https://twitter.com/AnneKFlaherty/status/1306379900375511051?s=19

It’s insanity but sadly I feel numb at this point.

3 Likes

Yep. No vaccine for me for awhile.

My wife and I were sitting down to watch The Boys and delayed because of how intense that segment was.

The more accurate and direct response to me would have been:

“I believe that High SDI leads to lower cases and Low SDI leads to more cases. I also believe that testing data has been unreliable for several months. I don’t actually have strong evidence that any of this is true, but I still believe it. I’m not a scientist, am not a skilled data analyst, and I’m not interested in trying to prove to someone else that my beliefs are true.”

I woudn’t have any issue with that response - you don’t owe me (or anyone else) any kind of evidence. There’s no shame in not being a scientist or being a data analyst. I don’t know how to play the piano, and I’m not a very good swimmer. But it’s a fact that absolutely nothing you’ve shown represents any kind of objective, falsifiable evidence to support your beliefs. So I’m going to continue to dismiss the SDI discussions and graphs until/unless someone can point to evidence that they’re meaningful.

As for this:

I look forward to seeing your cite to me downplaying the pandemic.

I do remember being more optimistic than some other people on here, saying things like:
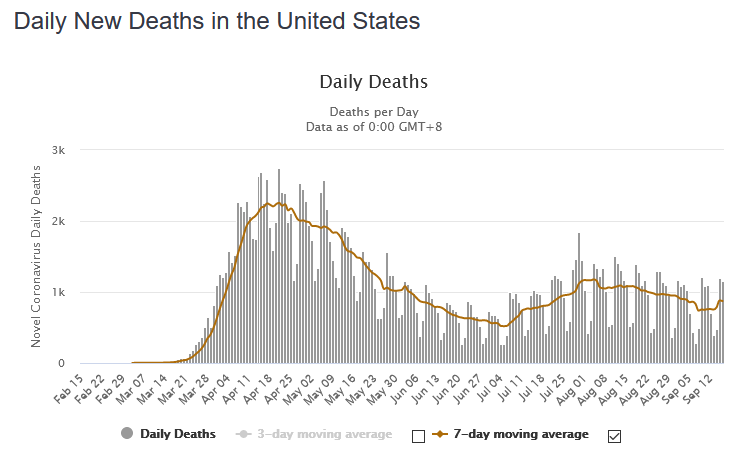
Those were all in July and I feel pretty ok with them based on how things have gone since then:

But again, I look forward to seeing your evidence of me downplaying things.

7 Likes

And as for my current projection:

I think that in the next 3-4 weeks, we’ll see the 7-day average deaths increase, but I’d be surprised if they break 1,100-1,200 at any time before mid-October.

***To state the obvious, deaths of this magnitude are an extraordinarily bad thing.

5 Likes

For your part about downplaying it, I concede you’re right that it wasn’t as dramatic as I remembered. I seem to remember you saying we would have had a big reduction in deaths by a few weeks ago, but if not, I stand corrected and I apologize.

Do you treat your students like this? I am very interested in backing up my beliefs on this hypothesis, but you told me you are not interested in seeing that or showing me what you’re looking for. That makes me immediately think you want me to waste hours of my time backing up something that you already think is lol. This is a really rude approach to me, by the way, but whatever. I hope you treat your students better.

Why don’t you tell me what evidence you’re wanting to see like I asked you to do? I very likely am compiling it. In fact, here’s the first bit to describe how testing is bulls***. If you think it’s not, based on this, then I guess I really don’t get math and statistics at all.

Testing for the last 9 weeks starting with measurement period 7/15-7/21 showing peak tests, low tests, and most recent tests for 9/9-9/15:

9 Week Test Peak, Low, and Most Recent Peak Tests in a Week Since 7/15 Low Tests 9/9-9/15 Tests
from covidtracking.com
U.S. Total 5,639,799 4,543,275 4,543,275
California 887,847 660,222 660,222
Texas 444,894 204,015 -91,584
Florida 414,507 141,007 151,974
Arizona 85,723 45,705 45,705
Georgia 231,073 117,264 117,264
North Carolina 204,543 163,472 182,463
South Carolina 82,130 48,295 60,586
Tennessee 181,198 133,240 164,438
New York 589,585 446,054 542,394
Illinois 391,814 261,678 332,284
Alabama 84,570 15,235 40,575
Ohio 209,986 151,958 209,986
Louisiana 173,553 78,529 123,604
Virginia 118,760 91,055 102,064
Arkansas 88,386 38,969 88,386
Utah 50,922 27,967 30,265
Pennsylvania 113,397 80,312 86,422
Mississippi 44,985 19,850 19,850
Washington 118,080 (actual high was bogus dump of weeks of tests) 75,518 102,662
Maryland 104,090 62,184 62,184
Minnesota 103,129 45,997 45,997
Oklahoma 91,636 38,227 91,369
Nevada 52,064 21,067 22,484
New Jersey 211,698 96,724 141,565
Iowa 42,025 30,635 30,635
Wisconsin 97,385 52,515 63,627
Indiana 103,868 66,396 103,868
Michigan 216,650 192,139 207,537
Missouri 94,522 56,597 94,522
Massachusetts 149,770 80,967 103,277
Colorado 64,570 36,438 36,438
Kentucky 135,789 40,229 135,789
Oregon 42,393 26,565 26,565
Nebraska 28,375 14,994 28,375
Kansas 30,356 17,405 21,695
New Mexico 55,187 31,372 31,372
Idaho 20,787 10,932 10,932
Connecticut 109,362 71,076 103,884
Delaware 16,747 10,189 10,189
South Dakota 9,916 7,028 9,410
Rhode Island 21,626 10,306 18,602
District of Columbia 23,754 19,682 19,682
West Virginia 37,845 24,319 27,886
New Hampshire 12,964 8,753 9,495
North Dakota 12,753 8,516 8,516
Maine 33,971 16,661 33,783
Wyoming 8,276 3,589 8,276
Montana 30,995 11,100 20,588
Alaska 40,424 15,468 15,468
Hawaii 38,830 7,360 24,895
Vermont 16,368 4,810 4,810

Out of 9 measurement periods, do you think you can get a reliable picture of what’s going on based on just this simple chart? If you feel I’ve proven my point here about thinking testing results are very unreliable right now based on what I posted, tell me what you want to see next. Teach me, don’t condescend to me.

If you still feel those numbers are reliable and think they’re fine, give me a lay person explanation as to why because I absolutely do not see how.

The way that science works is you make a falsifiable prediction/assertion, then you see whether the data confirms or refutes that prediction/assertion.

If you believe that SDI predicts new cases in some particular way, then make that prediction and test it statistically.

If you believe that testing numbers are obviously wrong, present the decision rule that you’re relying on that tells you they’re wrong. Then show how the data points to the decision rule rejecting the data being reliable.

I have no interest in teaching you how to be an empirical researcher.

4 Likes

Cool, good talk.

Being a Trump supporter is a contributing health condition.

2 Likes

Where is the SDI raw data?

Fina-fucking-lly, masks are now mandatory in classrooms in the Czech Republic. Made absolutely no sense for them to be only on in hallways.

Guess going over 2,000 cases in a day will trigger some changes.

Looks like we made it through the week. Circumstances weren’t as bad as I thought. When the students on quarantine come back on the 25th, things will change big time because I bet at least one will have it and spread it through the school.

3 Likes

SDI alone surely matters, but there’s like many confounding variables at play.

GTFO with this reg nonsense. reghdfe is the new hotness.

From what I’ve seen, SDI is an important indicator but the threshold is difficult, if not impossible to predict. First you would need to adjust for population density, which is easy enough.

Then you’d have to adjust for acquired immunity’s impact on R0.

Then you’d have to adjust for mitigation compliance efforts, such as mask wearing. That’s pretty much impossible.

I’m also pretty sure you’d want to adjust for whether socializing was being done indoors or outdoors, and that’s an issue too.

Oh and circling back to population density, you also have to adjust for household size. Take the same apartment building with the same number of people and turn all the 2br apartments with 2 residents into two different apartments with studios and you’ve significantly impacted the area’s susceptibility to the virus.

So SDI is something worth analyzing, but as all these other variables are shifting, I am skeptical that it can be reliably predictive. Even if it’s predictive in the same area once or twice, mask usage going up or down can render the next prediction inaccurate.

An inaccurate shot was clearly taken at me over data I’ve compiled, but I’ll bite my tongue and keep it constructive, positive and focused on the merit of using SDI and it’s strengths/weaknesses and leave it at that.

1 Like

The issue is that SDI, as far as I know, doesn’t account for mask usage. Measuring mask usage in any scientific way is quite a challenge, and it can vary over time.

Yeah if you’re trying to see what impact closing bars or restaurants has, for example, it should be useful. But the impact that has on SDI in Philadelphia may not be the same as the impact that has on SDI in rural Oklahoma.

Over 40 percent of parents have already opted out of in-person classes, and that number is likely to grow, reflecting families’ deep frustration about the city’s reopening effort and skepticism about schools’ readiness.

2 Likes

@nunnehi @marty

1 Like