If markets were mostly efficient, one of the biggest companies like FB don’t go down 20% in a few minutes.
Markets are mostly how much money do rich people have and willing to blow on the market? If yes, markets go up, if no markets go down.
If markets were mostly efficient, one of the biggest companies like FB don’t go down 20% in a few minutes.
Markets are mostly how much money do rich people have and willing to blow on the market? If yes, markets go up, if no markets go down.
This is a silly comment.
I don’t believe in EMH but the drop was easily explainable by new information.
Hope you didn’t listen to me.
Don’t underestimate pure panic. Lots of people investing in stocks know they tank sometimes, and they’re not all meme stock “strong hands!” holders. Tons of purely speculative investors are trying to time markets and it absolutely contributes to sudden drops.
Jobs report good = bearish
There’s a huuuuuge gap between “every security on the market is always perfectly priced at all times” (which I’d characterize as somewhat of a strawman for EMH) and "amateur can generate alpha by reading megacap earnings releases and understanding GAAP vs. adjusted EPS ".
Ford: UHH OH!
Yeah, this is very true. Notwithstanding the entire auditing profession, annual reports and quarterly reports are basically advertisements for the company. There isn’t a single annual report where management isn’t proud of everything they’ve achieved in the year and confident that future earnings growth is going to be even better. The MD&A are written by committee with PR professionals, they don’t really give you insight into the company’s big strategy bets. By far the most valuable thing in terms of actually understanding management is to listen to analyst calls because then they have to actually respond to investor questions. But generally speaking you’ll get nowhere fast with all this stuff - management talk is opaque and vague and people will generally map their preconceived notions on to the words.
The notes to the financial statements can be valuable in the sense that you can at least see how big a bet you’re making on a company’s intangibles. But a key life lesson is that the amateur is way, way more likely to make a mistake doing this than they are to uncover a hidden gem in the pricing.
Even the analyst calls aren’t very helpful because while they often do identify important topics they never get to follow up. So the well-coached executives get to spew whatever bullshit spin they practiced beforehand with no pushback, not unlike Trump press conferences.
Prices just keep getting higher and higher - I wonder how much of this is just being passed down versus “customers will pay it”.
If this is the way you’re inclined to think, you need to start with some real economic/physical constraint. For example:
Then you can look at the current market cap and map out if there’s any way for the company to grow its earnings into that market cap over 5-10-20 years without violating those constraints.
My issue with your original post was that your constraints didn’t seem to have any real rationale. Like, is it possible that Amazon’s market cap could be 5% of the total US market cap? Maybe? I don’t know. There’s nothing I can think of that would prevent it. Is it realistic to think a single company could generate 5% of aggregate revenues? No idea! Maybe?
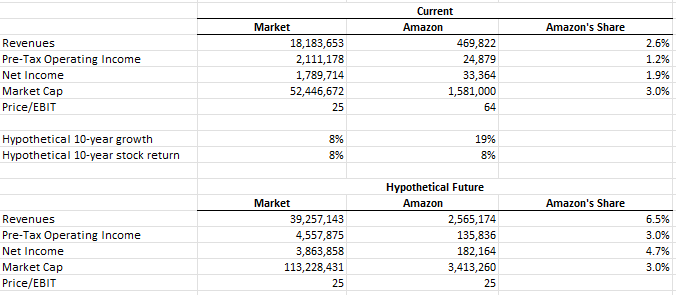
Here’s the current state of the world in terms of aggregate numbers, from Damodaran’s website:
There are roughly 7,200 firms with an aggregate market cap of $52 trillion. So Amazon at $1.58 trillion represents 3% of that market cap. Those firms generate an aggregate $18.2 trillion in revenue. Amazon generates about 2.6% of that. Those firms generate about $2.1 trillion in operating income. Amazon generates about 1.2% of that. (I’m ignoring net income because it includes the stupid Rivian effect, but Amazon generates about 1.9% of the aggregate net income.)
So the big question is, what does the world look like if Amazon were to grow into its valuation over the next 10 years by increasing revenues and earnings at a higher-than-market rate, while the stock returns exactly the market return? Here’s one way you get there:
You end up with Amazon revenues being 6.5% of aggregate revenues, and Amazon net income being 4.7% of aggregate net income. Is that too high? Maybe! Maybe not! I don’t know, but that doesn’t violate any obvious economic constraint.
Also, I definitely do not believe this:
And that isn’t a slam on the people in this thread - I don’t even believe it for me.
Gross accounting talk:
Looking at the 10-K that Amazon just filed, it turns out that they are actually accounting for their investment in Rivian as an Equity Method Investment. That would normally mean that they don’t recognize changes in market value on their Income Statement, but rather their proportionate share of Rivian’s income/loss. But they’ve elected the fair value option, which means Amazon will report price changes in their own income.
Our investment in Rivian’s preferred stock was accounted for at cost, with adjustments for observable changes in prices or impairments, prior to Rivian’s initial public offering in November 2021, which resulted in the conversion of our preferred stock to Class A common stock. As of December 31, 2021, we held 158 million shares of Rivian’s Class A common stock, representing an approximate 18% ownership interest, and an approximate 16% voting interest. We determined that we have the ability to exercise significant influence over Rivian through our equity investment, our commercial arrangement for the purchase of electric vehicles, and one of our employees serving on Rivian’s board of directors. We elected the fair value option to account for our equity investment in Rivian, and the 2021 valuation gain is primarily comprised of the gain recognized upon the initial public offering, and also includes subsequent changes in fair value through December 31, 2021.
Also interesting is that their estimated fair value incorporates a “discount for lack of marketability until Q1 2022” of about $800 million. So they arguably could have recognized an even greater gain on their most recent Income Statement.
Buffett’s excess returns are mostly explained by his exposure to known risk factors and leverage provided through the insurance business. These factor exposures have performed poorly for the past 15 years or so, and so has BRK.
http://docs.lhpedersen.com/BuffettsAlpha.pdf
Anyone ITT that uses leverage to buy factor exposure funds rates to beat the market long term.
Meh, I think it’s a stretch to attribute it to risk factors:
Buffett’s returns appear to be neither luck nor magic, but, rather, reward for the use of leverage combined with a focus on cheap, safe, quality stocks.
“Safe” and “quality” certainly weren’t even claimed to be risk factors until recently, and I don’t accept the idea that correlated movements in stock price necessarily reflect a risk factor.
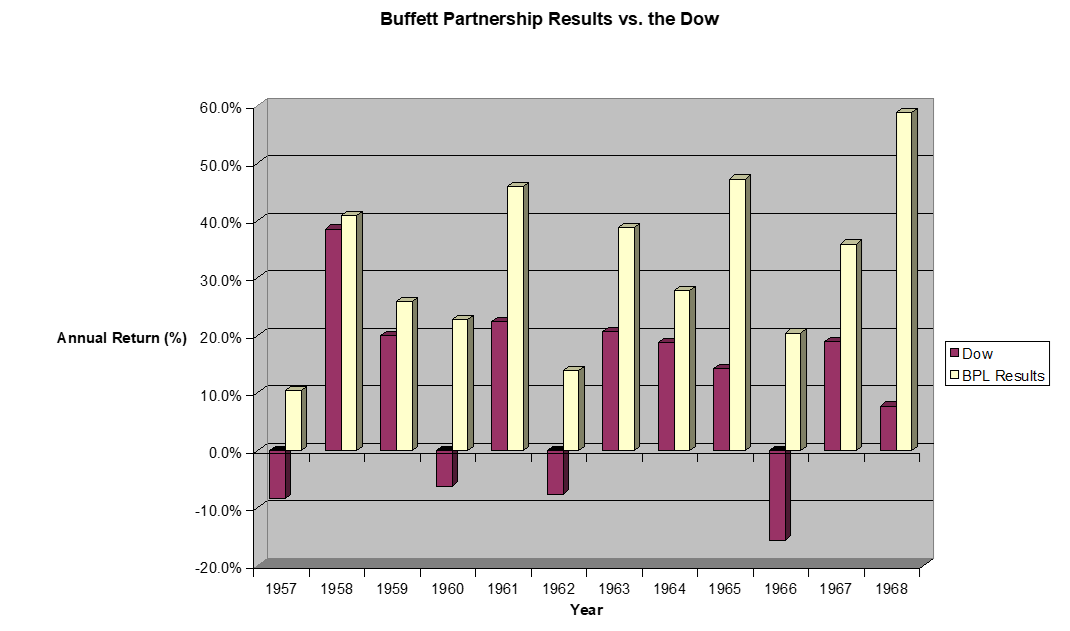
Further, this study ignores his tremendous results from his partnership:
which exhibit not only huge outperformance, but no down years. Super difficult to look at that non-leveraged portfolio performance and say that it’s driven by either risk factors or leverage.
The point I am trying to make (admittedly poorly by focusing on Buffett) is that someone can use some relatively straightforward financial screens (that correspond closely to Graham/Buffett metrics) and expect to beat the market long-term. That’s not contrary to EMH or Buffett being great.
Oh, sorry. I obviously misinterpreted your post.
I guess what it comes down to is how you define beating the market. If you view it as “higher returns than the market, the end” then I agree with you. But if you’re talking about risk-adjusted returns, which are more or less Sklansky bucks, then I think it’s a different story.
My favorite strategy for beating the market (in the first sense) is Capital Decimation Partners.
I personally would also define it as “generating returns in excess of risk” aka “generating alpha”, but I was using the more colloquial definition of “beating the S&P” which I’m almost certain is how CW is also defining it.
These Graham/Buffett value screens expose you to more risk factors and give you a higher expected return, but that’s not alpha.
AT&T was like 12% of the total US market cap in the 1930s. Barring antitrust (which was the case with AT&T), I’d say that a handful of companies occupying larger and larger %s of the total market is more the rule than the exception.
Bookmarked some great posts to come back to tonight when I have time.
Bought a few value stocks this morning… All based on Graham value criteria.
My usual weight: APT, IBA, PKX.
1/3 weight: ATHM
Plan to add two other stocks from China and Russia at 1/3 weight, the risk of investing in those countries is why I went smaller on those. Didn’t have time to finish research on the other two before an appointment.
I strongly disagree, unless you buy them indiscriminately based on the screens. I’ll elaborate more later, but take a look at IBA’s balance sheet and if you can make a case it’s more risky than the average S&P 500 stock, I’ll be stunned. $900M or so in cash against a market cap around $2B, and trading at a P/E of 7.8.
On the other hand there were two mining stocks that passed the screens, but I passed based on horrific management and massive geopolitical risk.
Ok, so you believe that across the last century, and in markets around the world, that there exists a persistent and consistent over-discounting (relative to risk) of future earnings of certain types of companies that can be identified by running some screens and reading some reports?