Anyone will tell you that my predictions are impeccable. See, for example, my current short positions in DoorDash and Apple.
5 Likes
Obviously at this point 40% are going to approve and 50% disapprove no matter what. It’s that fringe % of whoever the hell they are I don’t know.
I have been grappling with the GDP number. GDP is calculated in real dollars, so that means we need to back out inflation from the total number to come up with the real GDP as opposed to nominal GDP.
So what I am trying to understand is if the average headline inflation dropped two percent quarter over quarter from the first quarter. Does that mean that nominal spending actually decreased from from the second quarter? Does that indicate that spending is actually declining quarter over quarter?
When we think about stocks and earnings all that math is in nominal dollars so I’m just wondering if spending continues to decrease what will third quarter earnings look like? It looks like commodity and labor cost are still rising even though prices are deaccelerating.
Does any of that make any sense?
this does not make sense
I think you’re flipping “nominal” and “real” in that second paragraph. Nominal dollars from any given period are the dollar prices you’d see if you had, say, polaroid pictures from department stores showing their prices over a series of years. Real prices are not the prices that you actually observed at the time, but rather prices that are inflation adjusted to allow for better over-time comparison.
I think what you’re asking is, “Inflation has been so high, is it possible that our actual productivity (as captured by GDP) is only increasing because of increases in prices, not because we’re actually generating more goods and services?” I think the answer to that question is no. The Fed reports real (inflation adjusted) GDP, and that’s been growing:
And if you add the nominal GDP figures to that graph, it’s clear that recent inflation has made nominal GDP growth much higher than real GDP growth.
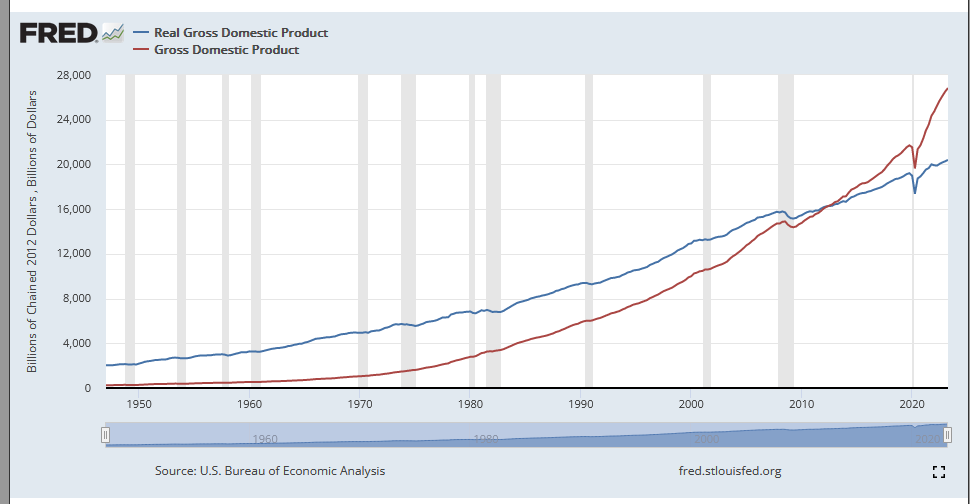
Of course, an even better measure would be real growth in per capita GDP, and you could go down an endless rabbit hole trying to distinguish between “good production” and “bad production”. (Like, spending a trillion dollars developing a nuclear weapon, and then another trillion dollars repairing the damage from that weapon probably shouldn’t be viewed as a two trillion dollar increase in living standards).
It’s possible I misinterpreted your question.
1 Like
GDP is just a terrible measurement for how the economy is doing

1 Like
Okay let try and rephrase my inquiry. I’m thinking that it’s a rare occurrence that we see large reductions in inflation in a short period of time, say a three month period like we have had from the first quarter to the second quarter of 23. The GDP rate is measured as an annualized rate against the 22 annual rate I believe? It’s not a quarter over quarter sequential or verse the 2 nd quarter of last year right?
So if we take the annualized rate of Q1 23 and compare that the annualized rate of Q2 and then we factor in a 2% reduction in inflation from the Q1 to Q2 we see a pattern of deceleration in nominal dollars even though we have a higher GDP number in the 2nd quarter.
Again sorry if I’ve got this wrong. My assumption here is that many people might overlook the reduction in inflation and it’s impact on nominal measurements of spending because typically inflation is very steady Q to Q.
I’m happy (eager?) to dive in more to this, but I’m not quite sure what you’re asking. I think it would be helpful to use some numbers and reported growth rates (and their sources) to help me better understand. I’ll throw together some sample data, and hopefully it will help lead to a meeting of the minds.
A couple of sources that should be useful:
Those provide graphs showing nominal and real GDP by quarter, and more importantly offer a button to download the actual data in Excel. Focusing only on the data since 2022, you’d get the following:
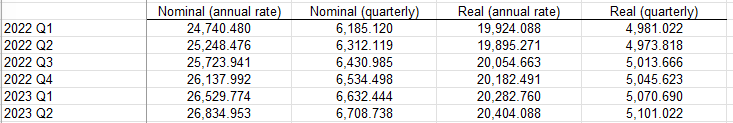
(The FRED website gives you annualized numbers, and I just converted the nominal and real numbers to quarterly by dividing by 4.)
So, how do people report the growth rates? Here’s the most recent BEA announcement of GDP from last week:
https://www.bea.gov/news/2023/gross-domestic-product-second-quarter-2023-advance-estimate
The headline is this:
Real gross domestic product (GDP) increased at an annual rate of 2.4 percent in the second quarter of 2023 (table 1), according to the “advance” estimate released by the Bureau of Economic Analysis. In the first quarter, real GDP increased 2.0 percent.
That 2.4% annualized number is not a year-over-year number. Instead (focusing on the last column from the table above), it’s the $5.101 trillion Q2 estimate of real GDP compared to the $5.071 trillion Q1 estimate, annualized, or 4*(5.101/5.071 - 1). Similarly the reported 2.0% increase for the first quarter is 2023 Q1 real GDP of $5.071 trillion relative to 2022 Q4 real GDP of $5.046 trillion, multiplied by 4 to annualize it.
I don’t think this actually answers your question, but maybe it can help guide the conversation.
1 Like
What is your preferred measure?
2 Likes
Re: low unemployment rate
Thanks for the links they were very helpful. GDP is measured quarter over quarter sequentially and then annualized. That answered my one of my questions.
Lots of detailed information, consumer spending, as I suspected fell off quite a bit in the second quarter. I think inventory building made up for some of that loss.
I’m just trying to get a handle on the direction of the economy and what the implications will be on earnings for the second half the year. Who really knows I guess, but I think I am a little better informed now then I was.
The soft landing narrative is the growing consensus among pundits. Maybe, maybe not. If we were headed towards recession if might very well look like a soft landing at first. Inflation coming down is what I would expect if the economy was headed for contraction. When consumers start to slow spending firms lose the ability to continue to raise prices as price becomes less elastic and unit volume drops. (See Tesla)
Sorry if I’m my comments seem a bit unorganized or incoherent, I’m just thinking out loud.
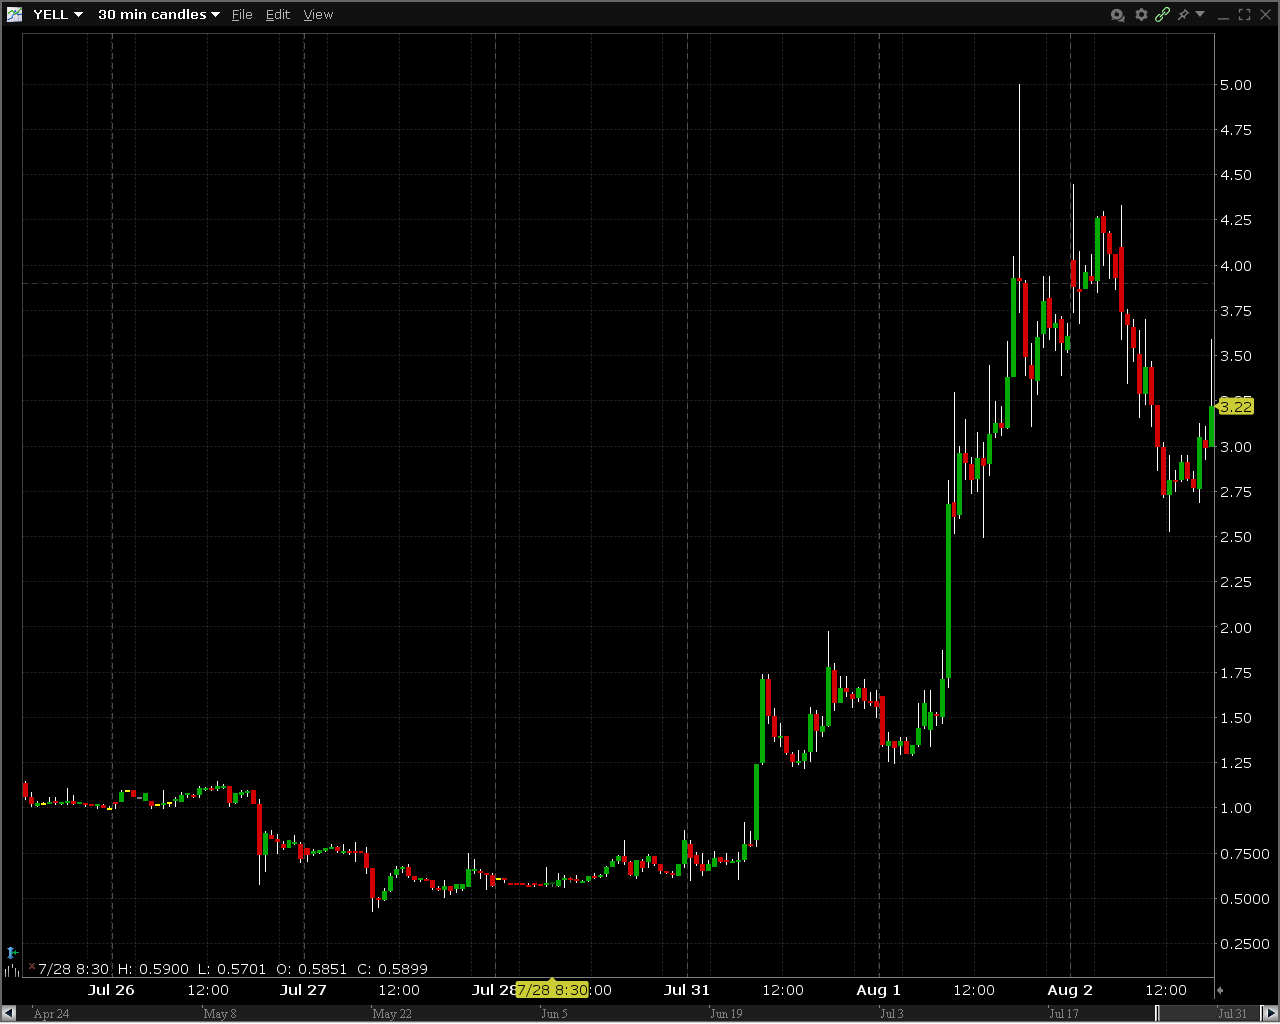
lol wtf sure seventy cents to four and a half–well that made somebody super rich somewhere
“YEESH,” wrote one user about the company’s outlook. “Still threw $3,000 at it. Did the same with [Bed Bath & Beyond] last summer. As long as I’m not playing with too much and have a stop loss I’m ok with losing a few hundred dollars for a chance to moon again.”
the incredible part is these people are still stupid. You somehow didn’t learn a damn thing.
They will always look at the trajectory of the price of these meme stonks and think “Well next time if I get in at the bottom and sell right before the collapse, I’m gonna be RICH!”
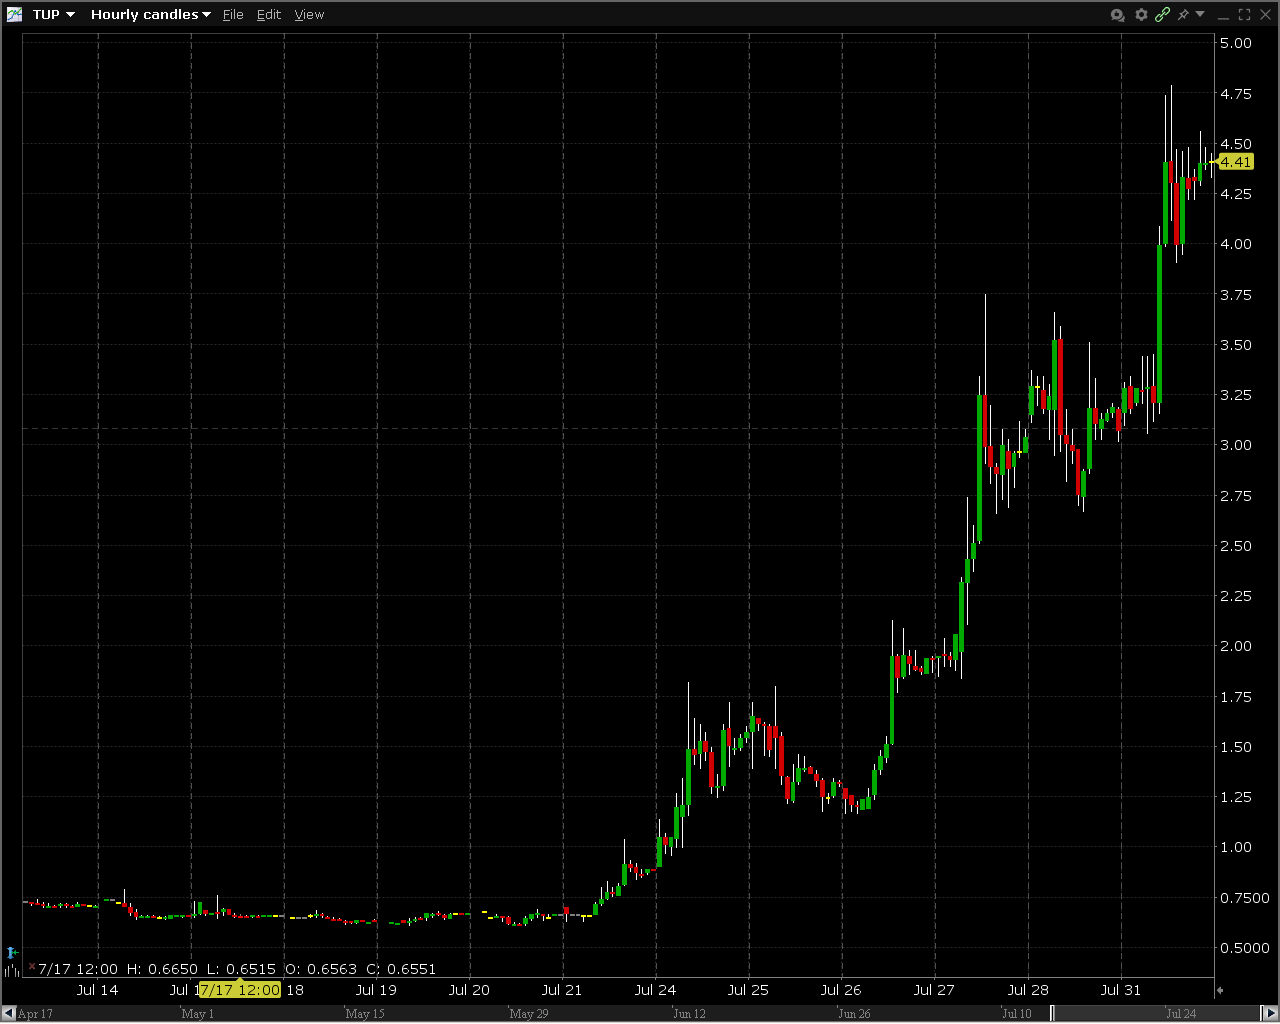
Haters! TUP is up another 23% pre-market.
Surely this time is different!

People like that are the smart ones. They know it’s a game of hot potato, whereas others intend to hold until $100,000/share or bust. You wanna see stupid, wait for the post-dump cult to form in a dedicated TUP subreddit, where they’ll be saying how the play was about fundamentals all along and Tupperware will soon have a monopoly on plastic and be worth trillions. Combine that with the usual penny ticker bagholder talking points like, “Regulation SHO will force shorts to close!” and “Not selling until (((they))) are in prison!” etc. It seems no matter how DOGE-like a stonk is, there are always some true believers.
1 Like
there is one thing tho–to the people who keep shorting sub a dollar stocks knowing there is an entire group of people just wanting to blow their money purely against you–you are incredibly stupid