and my guess is that it might be more useful/easier to handle than the county-level sources I posted above. But since I had already taken the time to write scripts for those sources, I haven’t looked closely at the NYT stuff.
The NY Times also has data for excess deaths, in case you want to try to convince any morons that, actually, COVID is killing a lot of people and not just killing people who would have died at the same point anyway. That’s here:
this is actually thinking about it backwards. it’s not like someone set the “correct” rate for all jobs and then after that some evil cabal figured out “hey we can fuck the rubes here doing what they love and cut their pay” and adjusted teacher pay down.
I think I understand what you’re saying. It sounds like:
Assuming that CFR is constant, you shouldn’t try to estimate that CFR with short windows of the deaths/lagged cases relation when that lag is unknown.
Better to measure the relation using longer windows because those longer windows will necessarily increase the proportion of true overlap between the deaths and the cases that led to them. (Interestingly, this is exactly the path that you see in accounting/finance research that studies the relation between earnings and stock returns. Maybe not interestingly.)
You’ll still have to make an estimate to account for both sides of that contemporaneous relation, but that estimate won’t dominate the estimated CFR the way it does in the short-window calculation.
I’m somewhat averse to this approach because I don’t believe that CFR is constant - one of the reasons I was interested in calculating an estimated instantaneous CFR is because I believed that the demographics of new cases would shift dramatically once schools started opening. (I’ll admit that this is inconsistent with my view that 21-day lag is the right one to use because it appears to be most consistent over time.)
In any event, here’s what I think you’re suggesting. This was very rough just based on eyeballing data from worldometers:
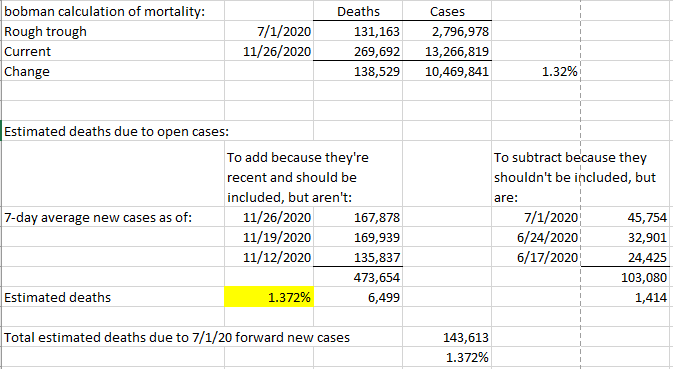
Identify the trough as roughly 7/1. Since that date, we’ve had 138,529 deaths and 10,469,841 cases. That’s a starting CFR of 1.32%.
Subtract from that number the deaths (early in the window) that were not due to post 7/1 cases. That requires some estimation, but I took new cases over the 21 days prior to 7/1 and multiplied them by Estimated CFR to get the deaths to subtract (1,414).
Add to that number the estimated deaths attributable to post 7/1 cases that haven’t shown up in the data yet. Again, requires estimation. I took last 21 days of cases (as of now) and multiplied them by the same Estimated CFR as in step 2 to get the deaths to add (6,499)
138,529 - 1,414 + 6,499 = 143,613 deaths attributable to the 10,469,841 post-7/1 cases, for an estimated CFR of 1.372%. (I iterated the numbers until the Estimated CFR converged to the total CFR.)
That sentiment doesn’t imply a secret cabal. You make this secret cabal accusation like once or month or something. It’s absurd.
The sentiment is not just wild speculation either, it’s documented sort of more than anecdotally in the book which is based largely on an obviously not rigorous (still not speculation) survey.
How many times does it need to be explained to people that classes of people often have similar feelings and the members act in similar ways without any kind of secret cabal?
Jesus, dude, the point is that you’re anthropomorphizing market forces. The “cabal” is just embellishment, the central point is that you are still fundamentally not comprehending how things work.
Sure, in a sensibly run country where bars are closed and restaurants are outdoors and distanced, that’s a difference well worth exploring and hoping to be able to take advantage of to minimize the spread while maximizing educational opportunities.
Because the subject of nurses working so hard and being so dedicated that they not only risk their lives during a pandemic, but are loathe to press for better pay because it means threatening to not help people came up.
oh cool, do you want to go over how the idea nurses don’t press to get paid more is ludicrously false or can we drop it now?
y’all are taking something that seemed to be pretty specific to the dutch and assuming it’s true everywhere when both of ya have no idea what you’re talking about whatsoever when it’s tangential to covid at best.
sorry for being short but tbf this is a really annoying derail.
Well, we did accept it as fact that two people on this board who are married to nurses knew something about the condition of their spouses’ employment.
Dude there’s an entire industry of nurses that are basically traveling free agents that move contract to contract. Turnover is common. Nurses labor actions are not uncommon whatsoever. Your assumptions are just flat wrong and uninformed. Nurses aren’t so altruistic that they don’t stand up for themselves.
Nurses aren’t all underpaid but a lot of the non-contract ones are. Here you get about 40k/year straight out of nursing school which is roughly what you could make sorting packages at Amazon.
Your not a nurse are you? A doctor right? Perhaps you’re right, but perhaps you’re not the right person to ask and not even as good as the spouses of nurses. And citing travelling nurses is pretty darn libertarian market zealot sounding.
I won’t disagree with some nurses being underpaid. My issue is the assumption that they don’t stand up and fight for themselves. That’s ludicrously untrue and super patronizing.