Non-personal post:
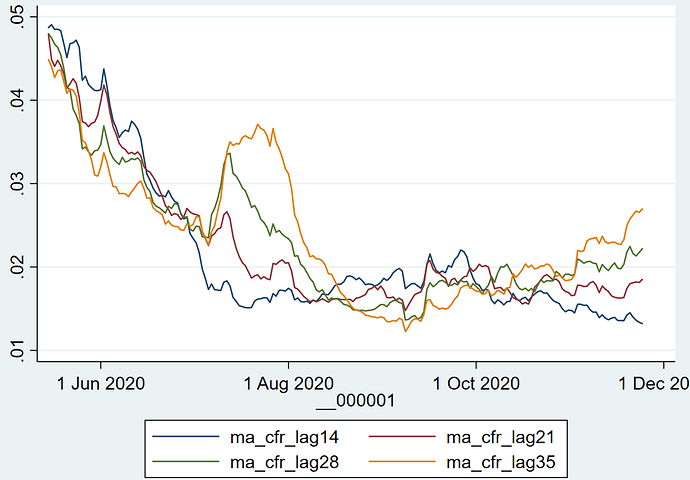
Looking at the data, I think the CFR seems to be pretty stable, but it very much depends on what you think the appropriate lag is. Here’s estimated CFR based on lags ranging from 14 to 35 days:
I happen to belief (based on nothing more than my gut) that the 21-day lag is the best approximation, partially because that one’s most stable over the last several months. If you focus on the longer lags (28 or 35 days), it looks like CFRs are recently increasing. But I think that’s a consequence of an overly-long lag that results in (relatively high) recent deaths compared to a much lower base of cases.
So I continue to think that somewhere around 1.6%-1.8% is the right number for a CFR. (I agree with an earlier post that CFRs could increase if we get major hospital overruns.)
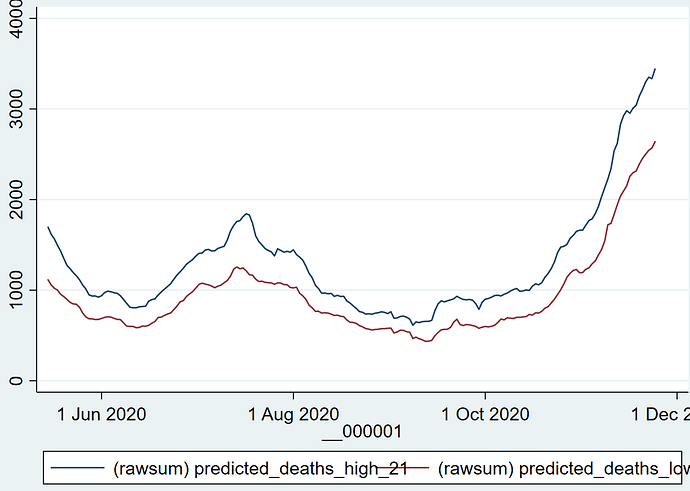
Combining the CFR with recent cases gives an obvious conclusion: Deaths are going to continue increasing. I think I’m a little more optimistic than some here, but it’s still very bad. I think we’re going to hit 2,500 7-day average deaths before Christmas. I appreciate that Thanksgiving travel and get togethers will bump up cases, but I’m optimistic(?) that the people who will be traveling and congregating are the same people who have been YOLOing it the last few months.
The interpretation of this graph is that you pick a date and the lines are giving a high and low estimate for what 7-day average deaths will be as of 21 days from that date. So the final point on that graph is saying that as of 11/24, the predicted 7-day average deaths as of about 12/15 will be between 2,500-3,500. If I were making fearless bets, I would take the under on 3,500 7-day average deaths for the rest of 2020. I think that makes me an optimist here.
[If anyone cares, here’s what I’m doing to generate these estimates: Calculating the estimated 21-day lag CFR for each state, every day. For each day, I then take the lowest and highest calculated CFR for that state over the last 7 days, to get a min and max estimated CFR by state, by day. I multiply those min and max CFRs by the state’s 7-day average cases for estimated deaths by state and sum those up.
I also do this on a national level in the same way: aggregate new cases multiplied by high and low estimated CFRs over the last 7 days. That method gives a tighter band between high and low, but roughly the same midpoint, which is what you’d expect.]


