COVID-19: Chapter 6 - ThanksGRAVING

I said that last week about my school but it appears that we’re gonna make it.

They’re not stopping college football unless a player or coach gets really seriously wiped out.

3 Likes

Yup. And “really seriously wiped out” means “dead”.

Absolutely nothing will change unless people (yes, probably multiple) start dying.

2 Likes

I’d give like 50% that Trump knows something that he knew 5 months ago.

Just because you passed your basic bio final doesn’t mean you still know what ATP is.

and died on the field with the tv showing medics doing cpr. CFB player already died from covid in d2. The excuse there was that they weren’t playing.

1 Like

I’m trying to understand what, if anything, SDI is useful for. It’s quite obvious that you believe it’s useful. I’m just not sure why. The goal of my post was to better understand if there’s anything I’m missing about SDI’s potential usefulness. Nothing you said in this giant post provides any evidence that it’s useful.

Uh, yes. My concern is that you decided that SDI must be useful, and you went looking for anything that would confirm this belief.

I know you’ve made this assertion a lot, but I haven’t seen any evidence that SDI is predictive of an entrance to a spike or an exit from a spike. Do you have any evidence of that?

The second piece of this quote is the one that leads me to often dismiss your arguments - you have consistently asserted that testing data is completely unreliable, but you haven’t offered any real evidence for that assertion, other than the fact that the testing data doesn’t comport with your own beliefs. That’s not a scientific mindset, that’s a mindset of someone who is only willing to entertain data as long as it matches their priors.

The search function sucks here, but when I look back to your big post containing your original report, I see a bunch of graphs that provide absolutely no indication of a consistent pattern between SDI and new cases. As far as I can tell, you eyeballed these graphs to come up with some “target” SDI and then claimed that breaching the target SDI had very obvious implications. But those graphs look crazily inconsistent and it’s hard to believe the relation you’re seeing is anything but noise.

This is the post I’m referring to:

It contained graphs like this:

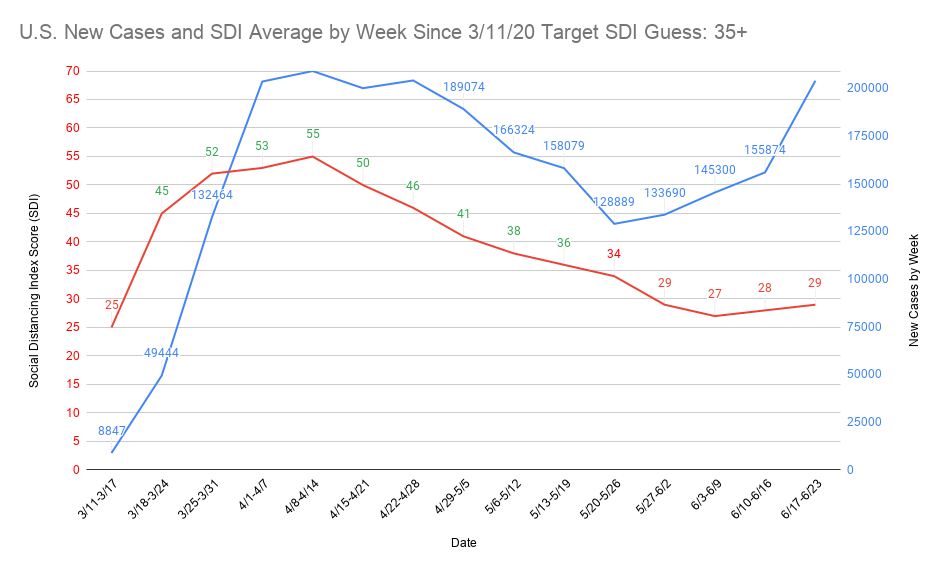
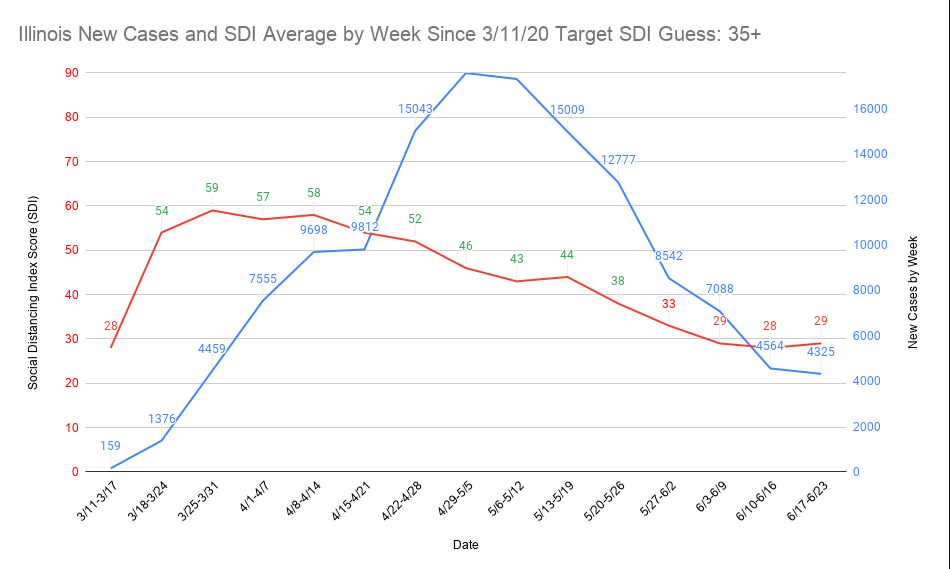
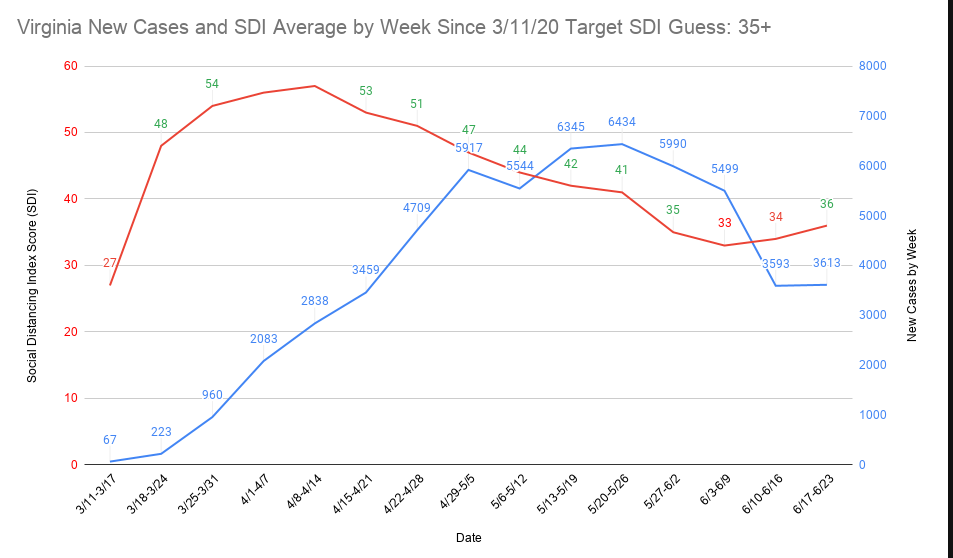
Looking through those graphs, I don’t see any particular link between measured SDI and new cases. Is there another post that you’ve made that shows a link?

Again my question is this: What do you believe the SDI data can be used for, and what evidence is there that it can be used that way?

6 Likes

It seems like a simple regression analysis would determine whether SDI is meaningfully predictive of cases in the future. Why this hasn’t been done by now instead of what has to be a huge amount of time basically compiling raw data, graphing it and speculating I have no idea.

https://www.villages-news.com/2020/09/15/15-more-local-covid-19-deaths-as-villages-area-reports-22-new-cases-of-virus/

6 Likes

They probably would have been accidentally shot at a Trump golf cart rally anyways.

2 Likes

Texas Lt Gov Dan Patrick volunteered I think (to die for the economy). Why not football?

I did some graphs a few weeks back that showed a general correlation for nun. I’m not going to be able to do much the next few days. Our turn for a funeral. The wife’s grandmother passed (fully expected).

Intentionally leaving late enough to miss the visitation and only going to outdoor service the second day.

8 Likes

Honestly fuck people hating on Nunnehi at this point. Like yes his views on everything else are ridiculous but you don’t have to argue with him and can just LOL, but he puts a ton of fucking effort into informing us ITT and whatever else he deserves respect for that. Even if the SDI turns out useless at least he’s trying.

This doesn’t include @spidercrab because he isn’t hating he’s asking honest questions and thats good too.

Thanks Nunnehi, I think your views on almost everything else are LOL but you’re a good dude and I’m glad you post here and I didn’t click that containment shit but it can fuck off.

12 Likes

my sister-in-law is positive for covid so now my parents-in-law are in risk. Israel is pretty much the nut low right now for corona and it’s only gonna get worse as the quarantine they are suppose to start on Friday is a total joke.

8 Likes

If you are referring to my post I am not hating on him. I am just pointing out there is a much easier way to find out if SDI is predictive of anything. If it is then great that is super useful. If it isn’t then at least he can spend his time on something more valuable.

No I don’t remember any specific posts and I think figuring out if SDI is useful is a helpful and good thing so you’re doing good too. Just meant the general Nunnehi hate.

Was the containment post about his SDI posts? I thought it was about his other non covid posts which are super lol but he isn’t fucking Avwal he’s just a good dude who believes in some wild shit.

No everyone agrees his Covid posting is good. The constant bickering and abusive posting elsewhere was the issue but I really don’t feel like that needs to be litigated further and it is resolved at this point at least for me.

1 Like

Was he contained outside of Covid? I feel like I let him down by not participating in that thread but honestly I’m dealing with a lot these days and some subjects I don’t have the mental energy to engage in.

Like his posting in the bailout thread could be considered abusive but also I mean I understood where he’s coming from. It’s a bunch of people of privledge who aren’t struggling telling people who are struggling to hold out so we can get a better deal and have less suffering. I feel our position was the right one but I think its reasonable for someone who has his views to be outraged a lil.

I also think lots of people here need to learn every single post doesn’t need to be defended until the death. You can just say Nunnehi I think you wild as fuck man and I strongly disagree with you but I think its ok for you to express your views while we all disagree and we don’t all need to take over threads trying to dunk on him. Or use the ignore function.

I’m just kinda high and really appreciative of his work ITT so I’m going to the mattresses for him even though like I said I’m on your guys side on all the other issues.

2 Likes

No it was 62/38 for non-containment or something close. I haven’t looked since yesterday. I mean I think the Covid posting is good. Whether that warrants constantly abusing other posters elsewhere anytime there is the slightest disagreement was the issue. The general consensus is, at least for now, to give him another chance.

2 Likes

Anyways who is good at regression analysis here? I have a grad degree in econ so I know how to so it but basically haven’t done it in 12 years so am beyond rusty. It seems like someone skilled in that could get the raw data from nunn and use some different lags to see if it is meaningfully predictive or not.

I’ve thought the SDI stuff very interesting but have similar concerns to spidercrab. I have hesitated to bring them up this whole time for obvious reasons.

Wasn’t @Trolly doing regression models in the early Covid days or something similar?

I’m just gonna say it’s not at all constructive to lead with an insult. I’ll go ahead and respond to your bottom of post question so you can dismiss the rest if that’s your goal.

To help states and counties determine what minimum level of shutdown is necessary to ‘contain’ spread based on their own area specific conditions. High SDI leads to lower cases. Low SDI leads to more cases. The only thing that alters that is the number of active cases in a place. Low active cases and low SDI still won’t allow infections to take hold quickly.

This data can be used to try to figure out what behaviors people are doing that lead to higher SDI and match shutdown activity to that. Do you think I’m somehow going to have that influence? This project is an additional ‘variable’ to what everyone else was studying and I for sure believe it has value as a variable. When I did this project, it was in case I would have to do almost exactly what I’m describing. The chances of that happening were minimal, but I wasn’t going to be caught with my pants down.

===

Getting back to how you started out with an insult, I’ll point it out in case you’re unsure what I’m talking about:

Then you said this:

Did I? Or did I think something interesting was going on with it and I wanted to see if there was something there? At the point I felt there was something there, I brought it up to people much smarter about this sort of stuff than me who agreed there might be something there.

And the lie. Nice hat trick to start off a good faith post. I cannot emphasize to you enough how much I made predictions based on what I saw coming in multiple phases of problem areas long before I told anyone about it. The pattern repeated, and outside of a handful of places I was one or two days on either side of the rise while doing it at a daily level which I’ve already said was a mistake.

Please tell me what you evidence you need. I’m not a scientist and am not even pretending to be. What do you think I’m saying claims I know what a scientist like you wants? Tell me.

So you think testing dropping by nearly 1 million per week over the last 8 weeks at the peak of the pandemic means testing is reliable? I’m staring at the nationwide testing data every single day. On the site I use, they only show it as cumulative. I’ve created spreadsheets that show daily new testing and I’ve been tracking it weekly since the peak of the pandemic. Testing hasn’t crossed 5 million weekly tests since 8/12-8/18. And there are all kinds of testing anomalies happening that make this data excessively noisy to me, in other words, unreliable.

Here’s an example of how testing looks nationwide:

Week 19 (July 15-21) 5,454,929 test results
Week 20 (July 22-28) 5,639,799 test results
Week 27 (Sep 9-15) 4,543,275 test results

A place that has relatively consistent daily/weekly testing can be considered reliable (Ohio for instance). A place that goes 2,000, then 5,000, then 1,000, then 25,000, then 8,000, and then reports x number of cases on a day with zero negative results is not reliable. That suggests a testing lag or a positive reporting lag. That’s what I mean by unreliable. If you really want me to go state by state to prove something that’s really obvious, I will, but your work is almost done here trying to discredit me.

See what I said above, it’s the exact same assertion I’ve made every time. If testing continues to be reduced almost everywhere, that means testing is unreliable as a metric for knowing what’s going on. My assertion that I’ve been making for at least 6 weeks is that no one can possibly know what’s going on because of the issues with testing and reporting. If you think I’m saying I know what’s going on, you should maybe re-read my posts.

Lie. I am agnostic on this stuff. I’m not trying to fit a narrative. If something looks good to me, I’ll report it. If something looks bad to me, I’ll report it.

You mean like all the people who used to post predictions like hospital overruns and deaths that stopped because the data didn’t comport with their beliefs? People like you who continue to downplay the pandemic and also stopped posting graphs that you were doing weekly a few weeks ago? Sorry to say I can’t understand half of your graphs because you don’t explain any of them in a way a lay person can understand and I’m not a scientist. I’m a lay person, present your data like you would to a lay person. I’m certainly not presenting my data like I’m a scientist.

As of right now, very little data is being posted in this thread. That’s a problem. How do you think things are about to go?

No, that’s not the original report. This is the original report. It’s post 8400 in the same thread from a few days earlier.

As you are a professor, please tell me how you want me to present the data to please you. I’m not a scientist and certainly am not attempting follow any version of the scientific method. But quite frankly, I’ll go ahead and say my methodology was this.

There was a 14 day incubation period of the virus. At the time it was roughly 5.6 days to show symptoms. That meant a test probably would be had around the 7 day mark and I had an assumption that it would take 7 days to return a test (some places better some worse). That meant if my assumptions were accurate you would see a rise in cases roughly 2 weeks after an event where it appeared there would be spread. Low SDI is indicative of a potential spread event.

Each place has a different active case level and population density, so that means each place has a different SDI. Again, I did not graph this stuff when I made my ‘predictions’. When I saw the graphs, I saw the correlation to my assumptions. I was agnostic to the data. That made me create a base assumption that this target SDI GUESS would be the initial SDI to see rise or fall happen. I was not certain about any of this. It also appears when referring to my graphs that you didn’t know some were representing one side of the SDI spectrum while others were representing another.

Graph Explanations

MA is showing the long term effects of being above target SDI guess as well as showing that cases clearly slowed falling at the 14 day mark as the state fell below its target.

NV is showing a place that had low active cases and had remained above its target SDI guess for a long time. Within 14 days of falling below its target SDI a significant rise began.

Not even sure why you would include the U.S. graph here but whatever. It shows that spread began as the country as a whole fell below the target SDI guess of 35. Because it’s such a large area being covered, it would be the least reliable SDI metric and is more demonstrating the trend.

LA is showing a messy SDI place where you can still see the cases ebbing and flowing. It also shows how high SDI helped them get near a truly bent curve. History tells us that didn’t hold.

VA is showing how hard it can be to get a place under control once the spread is vast. The SDI guesses are in 5 point increments which means that a place on the line might have a slightly higher SDI needed. Guess what? It’s a guess, there’s no way to know for sure. What you should have seen from that graph was when the target SDI guess was fallen below, the case lowering hit the brakes and eventually the rise began.

Again the target SDI guess were just that, guesses. If more data came in to show them wrong, I would adjust my guesses to reflect that. The noise was at the daily level. You can dismiss this all out of hand if you want, but to act like I just threw this all together to prove ‘how smart I are’ is really really insulting.

If you just put a bunch of graphs up without explaining your actual problems with each one, I have no idea what you’re asserting. I’m not going to guess what your problems are with the graphs, you’re going to have to teach me the error of my ways so I can tell you what the thinking was behind them like I did in my graph explanations. As I basically said above, you’ve again diminished this to ‘me looking at graphs and saying aha!’. There was a lot that went into how I came up with this stuff and I asked to be checked well before I brought it up.

1 Like