Yeah that one study found small children to be only half as infectious as the germ-garden-sprinklers they usually are. School should be fine.
Great news. Good thing we don’t need adults in schools and day cares.
Looks like it to me!

Three weeks into strict lockdown (and mandatory face masks for a week) in Melbourne (Australia) and reports are we have over 700 new cases today. Up from 295 yesterday and 30% higher than our previous record.
The long-term effects seem like a pretty good reason to keep kids out of school.
Here’s data for Texas that will be of use I think. I’ve caught up cases to 7/28. This list includes daily new cases by week, daily total tests by week, and positive percentage average by week. How did your prediction go with the new week of cases?
Texas Tests/New Cases/Positive Pct. Data by Week
| Date by Week | Texas Postive Weekly | Texas Total Tests Weekly | Texas Positivity Average Weekly | |
|---|---|---|---|---|
| 3/11-3/17 | Week 1 | 51 | 1,262 | 4.0% |
| 3/18-3/24 | Week 2 | 346 | 10,245 | 3.4% |
| 3/25-3/31 | Week 3 | 2,856 | 34,681 | 8.2% |
| 4/1-4/7 | Week 4 | 4,996 | 50,653 | 9.9% |
| 4/8-4/14 | Week 5 | 6,362 | 64,180 | 9.9% |
| 4/15-4/21 | Week 6 | 5,572 | 64,504 | 8.6% |
| 4/22-4/28 | Week 7 | 5,975 | 100,960 | 5.9% |
| 4/29-5/5 | Week 8 | 7,198 | 134,024 | 5.4% |
| 5/16-5/12 | Week 9 | 7,679 | 118,641 | 6.5% |
| 5/13-5/19 | Week 10 | 8,864 | 170,838 | 5.2% |
| 5/20-5/26 | Week 11 | 6,648 | 127,735 | 5.2% |
| 5/27-6/2 | Week 12 | 10,008 | 174,999 | 5.7% |
| 6/3-6/9 | Week 13 | 10,685 | 171,816 | 6.2% |
| 6/10-6/16 | Week 14 | 15,953 | 217,040 | 7.4% |
| 6/17-6/23 | Week 15 | 27,164 | 276,012 | 9.8% |
| 6/24-6/30 | Week 16 | 39,616 | 311,608 | 12.7% |
| 7/1-7/7 | Week 17 | 50,599 | 402,604 | 12.6% |
| 7/8-7/14 | Week 18 | 64,473 | 441,866 | 14.6% |
| 7/15-7/21 | Week 19 | 66,681 | 511,575 | 13.0% |
| 7/22-7/28 | Week 19 | 52,526 | 467,459 | 11.2% |
Ripping through aged care homes. Very difficult to keep it under control there.
1410 deaths today so far.
Does anyone want to decipher the impact of this:
I guess my question from that is why was their old system counting less deaths than those stated on death certs? Is this possibly the source of the death stat fuckery in states like Texas? Every county was just a choose your own adventure on what you reported or what?
If they’re waiting for lab results, they will delay when they see this second wave of deaths, plus either some tests are going to be wrong or some docs are misdiagnosing COVID cases.
But presumably they never went back in and added (or subtracted) these deaths right? At least I have not seen any huge adjustments in Texas data until the last few days.
If they were only counting deaths with confirmed covid tests at the time of death that would severely undercount the true death count.
stares in German
heh, I should have added *for the DMV
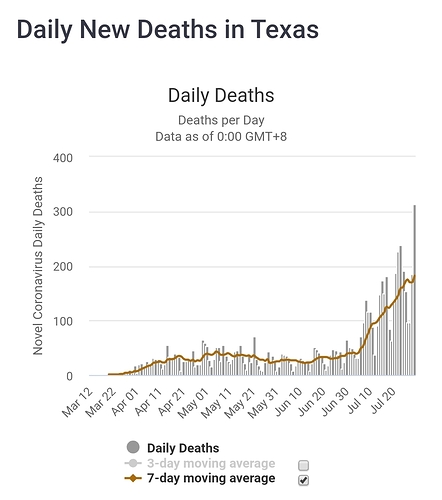
On July 27 , Texas added 675 additional deaths through death certificate reviews. However only 44 deaths were truly new deaths on July 27 . This will inflate the daily increase in deaths until the timeseries has been backfilled based on this revision
Ya I did see that adjustment. It sounds like from the article I posted there were 450 or so deaths just from Harris County that were added. So maybe most of the rest of the counties were already doing it the way they are now or maybe more will be adjusted as we go.
The 7 day average usually looks like it’s trending down because they only report like half the deaths on a given day, then go back and backfill them later.

