Why will they be smaller?
Will we have better test and tracing? Will we lockdown faster? Will mask compliance rise?
Why will they be smaller?
Will we have better test and tracing? Will we lockdown faster? Will mask compliance rise?
Oh man, this looks great! Looking forward to sitting down and reading through it.
It’s fantastic. I read it in his book he released a couple years ago. Probably my favorite Okie author.
https://www.amazon.com/Impossible-Owls-Essays-Brian-Phillips/dp/0374175330
With more people having antibodies or dying, the virus will have a tougher time finding vulnerable people to infect.
Ah, so not a true 1500 today.
Won’t be long tho
localized waves in specific locales that have heavy waves now, sure.
But a lot of places aren’t having huge waves right now and will have larger ones in the future.
Yes, .5% in July 2020 is a decent guess for representative population. You tend to always assume the absolute worst estimate for any number you ever heard is the real number. You never even try to back up your worst case assertions.
But the point is we’re new cases aren’t going to be representative population anymore. Behavior has changed. IFR for cases right now is going to be much lower than IFR if it had happened in March. And some populations are older and more at-risk (N. Italy) and treatments are better. IFR a constantly moving target with a half dozen variables at least.
Asserting you know what IFR is now, in the US, based on N. Italy or NYC (along with Spain, I believe the only places close to 1%) is ludicrous.
No 1% is a nice conservative pretty accurate number.
0.5% is just not accurate
I’ve gone over the reasoning a bunch in the past. Not gonna do it every time.
.5% is a good number.
1% is just not accurate anymore.
Fun game!
I’m putting you on ignore. I’m sick you just asserting everything is 50% worse than the worst case scenario with no argument to back up anything.
Yeah but a lot of them aren’t the ones out there getting covid. At least not in the first part of the big wave. There have been plenty of articles about how the people in hospitals are skewing younger - which can only mean the population catching it is younger.
Not sure why everyone here just ignores that.
Maybe if I phrased it negatively, “Yeah but old people are going to get really whallopped soon, since this wave is younger”. So things will get worse than they are now. Soon.
There, does that satisfy the “everything is always bad and only getting worse and nothing else will be tolerated” crowd?
WEKRERU124123 124123@#$#$
Some of you tilt me. I need a break from this place.
You’re going to wind up ignoring a lot of people here with that attitude.
Locally in Horry County SC a few places stopped offering tests a couple weeks ago.
Everyone else at least tries to back up their arguments. Nich’s numbers are always on the absolute worst end of the spectrum (and then I swear he just adds +50% for fun). And he just blandly asserts his made up numbers like “oh you sweet summer child”. It’s very tilting.
I challenge him to find one post where he wasn’t on the “worst” side of any argument. It seems important to him to never get outflanked on how bad things are now, or how much worse things are going to get.
I’m the one who said 2000 deaths per day in about 2.5 weeks. I posted my whole analysis. It’s not like I’m some optimistic pollyanna. But 1% IFR is stupid right now for any real population that’s actually catching it. 1% IFR was an older/at-risk population, especially nursing homes getting blindsided, and hospitals having no experience with better or worse treatments.
There’s no reason for IFR not to be much lower in Florida in July than N. Italy in Feb. Plenty of other studies in places like Germany have come in at .5% IFR, .3% IFR, etc.
It’s really dumb to just pick the absolute worst case scenario from Feb. and keep asserting it for every scenario now. It drags down the conversation here. You can say I’m wrong but at least back it up with arguments - like Dan Spartan, NewT, Wichita, etc.
I looked up what the stoopid scientists seem to think and 0.3%-1.5% is the range. Seeing 0.5%-1.0% is pretty common. Meta-study coming in at 0.68%.
Seems like this whole area is fair to call a reasonable estimate for the general population.
Sure. But again - IFR for the general population is an academic argument now. People getting it now are not the general population anymore. Nursing homes are not getting blindsided, or at least much much less often.
“COVID-19 is the first disease in modern times where the whole world has changed their behavior and disease spread has been reduced,” Britton noted. That made old models and numbers obsolete. Social distancing and other reactive measures changed the R0 value, and they will continue to do so. The virus has certain immutable properties, but there is nothing immutable about how many infections it causes in the real world.
He’s doing this in the baseball thread as well… it’s tilting.
That’s a fair point and in the:
A: I think it’s 0.5%
B: That’s stooopid, it’s at least 1.0%
A is a lot better.
The argument that it would be expected to get lower as the most at risk people die? Or as we are now protecting older people? Probably true, but maybe not that big an effect as it’s still quite a minority of older people who have had it. It could just make it like 0.9% instead of 1.0% or whatever.
It’s clear though that the IFR for younger people is way way below even 0.5%. It’s like 0.01% for 20-49 year olds.
Are you sure you want to plot cumulative cases? It seems less useful than new cases since that line will never come back down.
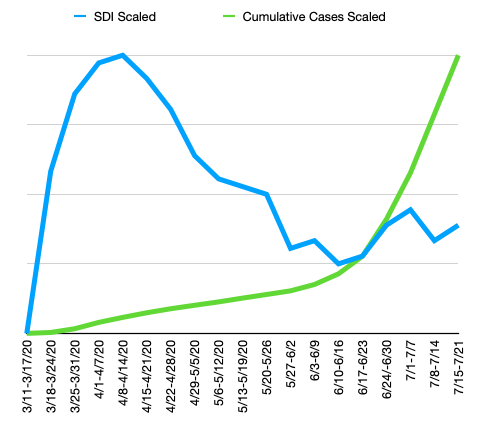
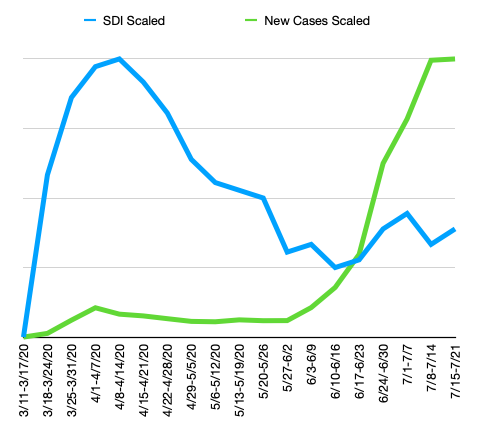
But again, these charts have lost all y-axis info. Unless you really need to convert to a common scale for comparison between the curves, it might be better to scale your chart axes instead of scaling the data. In other words, if your 2-axis charts scale each y-axis to range exactly from the min value to the max, the visual effect will be identical to the scaled chart above, but without losing the unit context.
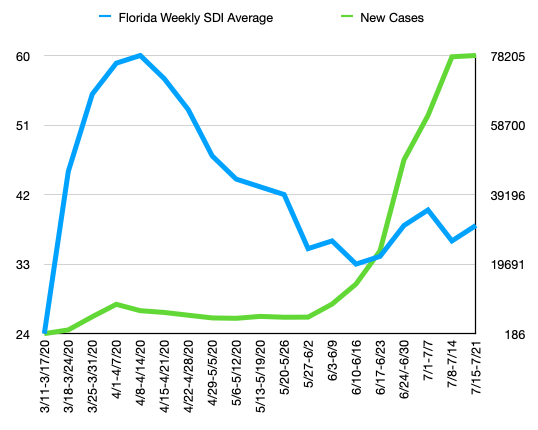
(Note e.g., the SDI axis ranges exactly from 24 to 60, the min and max values for the data.)
I think it could be lower than .5% if the population is skewing really low.
Also a lot of those IFR numbers are based on antibody studies:
https://www.nature.com/articles/d41586-020-01738-2
Kilpatrick and others say they are eagerly awaiting large studies that estimate fatality rates across age groups and among those with pre-existing health conditions, which will provide the most accurate picture of how deadly the disease is. One of the first studies to account for the effect of age was posted on a preprint server last week. The study, based on seroprevalence data from Geneva, Switzerland, estimates an IFR of 0.6% for the total population, and an IFR of 5.6% for people aged 65 and older.
But the big wildcard here is a lot of people don’t even develop antibodies - up to 50%. So in theory if you swab tested all those people at the right time, you’d get an IFR of .3%.
However if those people can catch it and spread it again soon, which we don’t know, then they aren’t useful to herd immunity. So there’s one IFR snapshot and possibly another one if you want to gage herd immunity.
Here is one piece:
Excess deaths are more than 30% over covid deaths this year and we were under 2019 for the first 3 months.
Try adding 30% to covid cases and see what that does to your IFR