I guess it’s pretty reasonable to believe that waves are going to continue to happen but each one will be smaller than the last, right?
I would for sure think so. It looks like rents for new units at my complex are down around 10% right now, while the amount of apartments for rent is only slightly higher than normal.
That’s not too far from the delay NYC had.
It won’t happen. I don’t know the laws in all states, but in the ones I do there are several steps involved in eviction, and multiple steps that will get absurdly backed up if too many evictions are pursued.
Still likely going to be crazy, but just stating the logistics don’t exist to actually process evictions in any large number.
1 Like
Re rental markets.
In Melbourne. Areas with lots of international students, rental rates have dropped considerably. But in the nice coastal area where people have holiday homes the price has gone up, because all of the rich folks working from their second home and reducing rental supply.
Mrs Rugby and I are looking for a new place. It’s weird because our range covers the top end of the student market and the bottom end of the professional market, so the price difference between pretty similar places is crazy.
These kind of short term effects will work themselves out over time of course. But it’s weird now.
SC is pretty close to my target SDI guess right now (-1 as of last Tuesday) and had 2 weeks they were at or above the target SDI guess but have now been below target for the past 2 measurement periods.
I think most of the case drive is due to the 4 week period from Memorial Day weekend to June 23 when SC was below the target SDI guess (5 points or more for 2 weeks which I think leads to big rises). The slowing is probably legit for the next week, but will probably pick up a bit again the following two weeks. In a couple of days, I’ll be able to get a good guess of last week’s SDI to see what that might lead to a couple of weeks after that.
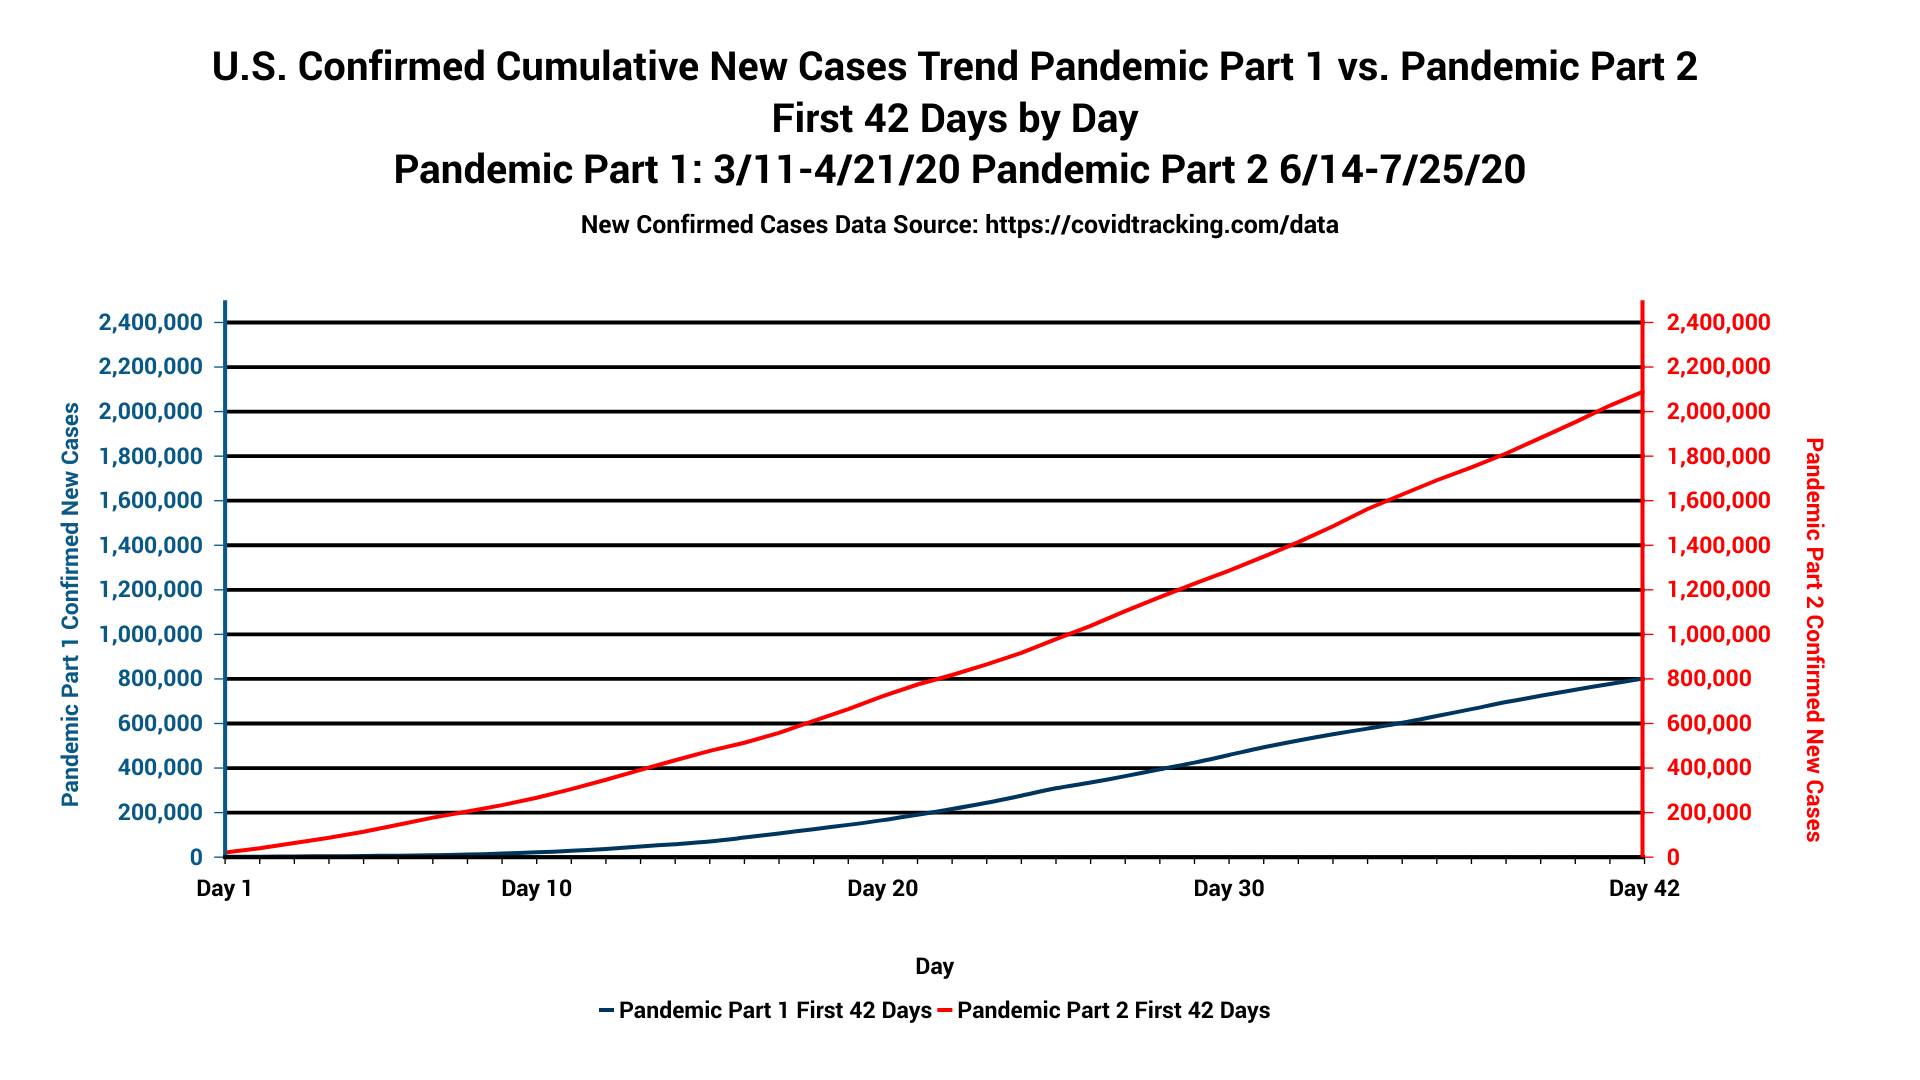
I’m calling it Pandemic Part 1, Part 2, etc. These are all just tsunamis in the first wave. I’m working on doing a test percentage graph, but this is a graph that compares the first 42 days of what I call Pandemic Part 1 and Part 2. No matter how much testing would have been done in Part 1, Part 2 is unequivocally worse in new cases than Part 1 was.
I consider Pandemic Part 1 to be 3/11-6/13/20. I consider Part 2 to be 6/14-Present (will probably go through at least the middle of September without odd miracles).
Arizona and Texas are 4 weeks at or above their target SDI. Florida is barely on the way up but is still below its target SDI (only had 1 week at its target SDI guess in the last 8 measurement periods).
I think Florida’s 12k+ (using 1point3acres at a glance) spikes Friday and Saturday are the result of Florida’s poor SDI 7/8-7/14 (7/8-7/10 and 7/13 being the focus of those). If there’s another 11k+ added tomorrow or Wednesday, it’s likely from that week’s SDI performance.
How does one make a scaled graph like that?
2 Likes
Movie theatres opened in Winnipeg over the weekend, they were already open in Ontario.
WB is hoping to release Tenet in Canada/Europe on Aug 28th now and maybe the USA on labor day, but lol@that
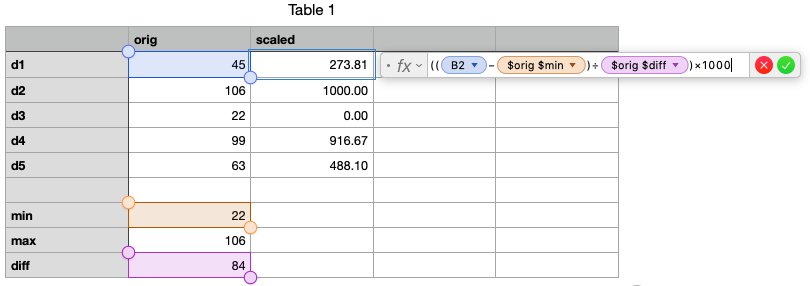
To allow the curves to be compared without regard to units, I manually “transposed” both cases and deaths to range from 0 to 1000 using:
Vscaled = ((Vorig - Vmin)/(Vmax - Vmin))*1000
Clarification below:
UP is generally a little ahead of the curve.
6 Likes
Should have been good enough for The Show imo. Sorry ![]()
I’m not that advanced, unfortunately. Are you able to make a scaled graphed version of this data?
Data Test
| Measurement Period | Florida Weekly SDI Average | Florida Weekly Cumulative |
|---|---|---|
| 3/11-3/17/20 | 24 | 186 |
| 3/18-3/24/20 | 45 | 1,412 |
| 3/25-3/31/20 | 55 | 6,338 |
| 4/1-4/7/20 | 59 | 14,747 |
| 4/8-4/14/20 | 60 | 21,367 |
| 4/15-4/21/20 | 57 | 27,495 |
| 4/22-4/28/20 | 53 | 32,846 |
| 4/29-5/5/20 | 47 | 37,439 |
| 5/6-5/12/20 | 44 | 41,923 |
| 5/13-5/19/20 | 43 | 46,944 |
| 5/20-5/26 | 42 | 51,728 |
| 5/27-6/2 | 35 | 56,541 |
| 6/3-6/9 | 36 | 65,004 |
| 6/10-6/16 | 33 | 79,113 |
| 6/17-6/23 | 34 | 102,507 |
| 6/24/-6/30 | 38 | 151,438 |
| 7/1-7/7 | 40 | 212,798 |
| 7/8-7/14 | 36 | 290,633 |
| 7/15-7/21 | 38 | 368,838 |
My goal is to see if the crests look like they’re on a two week lag or any kind of other obvious lag (good vs. bad SDI etc.). There’s no easy way I’ve figured out to do this yet (the SDI weekly average vs. new cases weekly average graphs are the closest I’ve gotten it visually so far).
Do you think Virginia, Florida, SC, Georgia, Tennessee, and California are near their max daily testing capacity?
IFR is not 0.5 for a representative part of the population.
1% is a good guess, 0.5% is a horrible guess.
Particularly not in lol Florida. There are a lot of old people in Florida.
1 Like
Also there are 108M Americans in the Service Industry and about 30% of adults think this is a hoax.
There is a LOT of low-hanging fruit still out there. 20% is not the extent of low-hanging fruit.
2 Likes
WHAT???
It’s at 1500 deaths TODAY.
We’ll hit 2k in a day in early August and 1500 7DMA in August as well.
We should hit a 3k day in August
1 Like
DeSantis knows that people of color are more likely to die from this. He also knows that they vote Democrat.

Roll Safe more likely to go than anybody in The Villages
Or the delusional end.
We may hit 2k deaths within 2 weeks given we have 1500 today.
I hope you’ve read this Brian Phillips essay partly about Hakuhō.
3 Likes
Texas reported >600 deaths today, so their backlog is skewing the national total