So why are FL and TX so low on the change? They have flatlined because of masks? slowing down testing? Why is post % in TX going down?
Exponential grown like this doesn’t last forever. Eventually the virus runs out of susceptible people to infect. CA still looks like COVID is going wild.
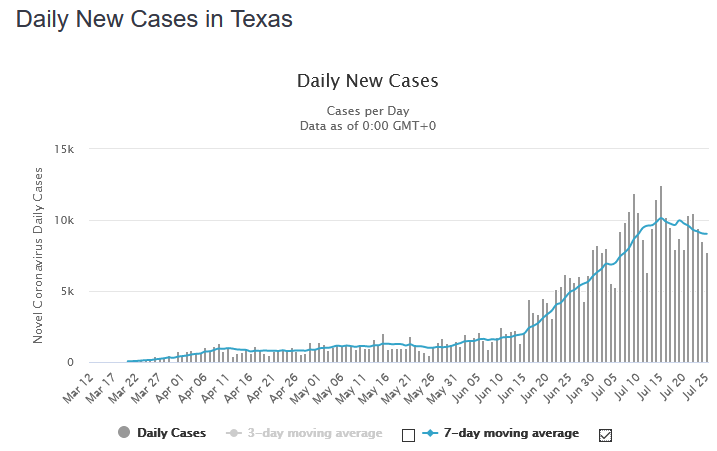
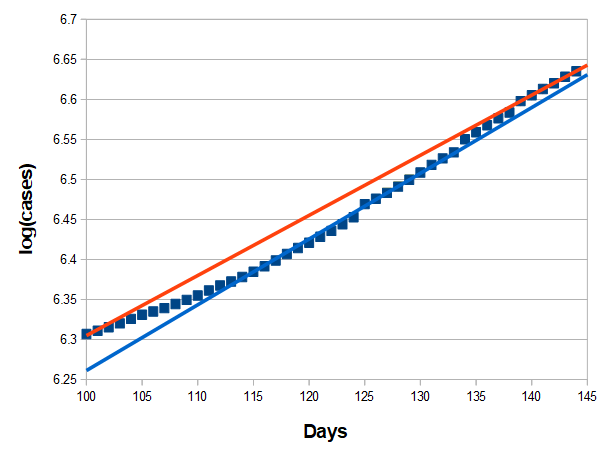
The rate hasn’t changed over the last two weeks. We’re on track to reach 5.3M cases two weeks from now.
Mask compliance has been significant better in Austin this last couple of weeks. Not sure how it has been elsewhere. The fear is palpable though now.
ultimately the virus is in charge. If things start to get close to Northern Italy or NYC levels the place is going to shut down no matter what the government does.
https://twitter.com/SquireForYou/status/1286792955756453888?s=20
Let’s see if this wakes people up. Prolly not. I hope he recovers.
1 Like
- Scientists have a new treatment idea for the novel coronavirus that came about after they figured out what makes the virus so dangerous to our bodies: The pathogen camouflages itself after infecting cells to prevent a swift response from the immune system.
- Researchers from the University of Texas Health Science Center identified an enzyme the virus produces that tricks cells into believing the viral RNA belongs there.
- This mechanism would delay the immune response and allow the virus to replicate inside cells.
- Therapies targeting the enzyme could prevent the coronavirus from hiding in plain sight.
7 Likes
This is pretty interesting, but it’s not too likely to have short-term therapudic implications. Unless there are known and approved small molecule inhibitors that are likely candidates to work here, designing new ones to target this functionality will take years.
But how fat is he?
Offensive and stupid is evidence the guy filming is wrong in his criticism.
https://twitter.com/davenewworld_2/status/1287143403625631746
1 Like
According to the twitter comments, 231 pounds and a pitcher, so obviously unhealthy. (I have no idea why being a pitcher makes you unhealthy, but who am I to argue with twitter replies?)
That is obviously a very relevant consideration. I think very likely we will see more of these kinds of cases in MLB and NFL, than NBA, since it’s more common for people in the first two to be overweight or obese with high BF percentage. NBA players are probably at lowest risk for these types of outcomes.
The woman should be wearing a biden2020 tshirt obviously, for her social statement to work at all, according to her reasoning. But even she realizes it would look absolutely too insane. You gotta pick one or the other. But instead of (imo effectively) wearing biden gear and acting like a lunatic in public, she wears the nazi gear and acts normal!!!
1 Like
Hospitalization in Bexar County has been decreasing for about a week, so it’s a real drop.
Update from the data modeler:
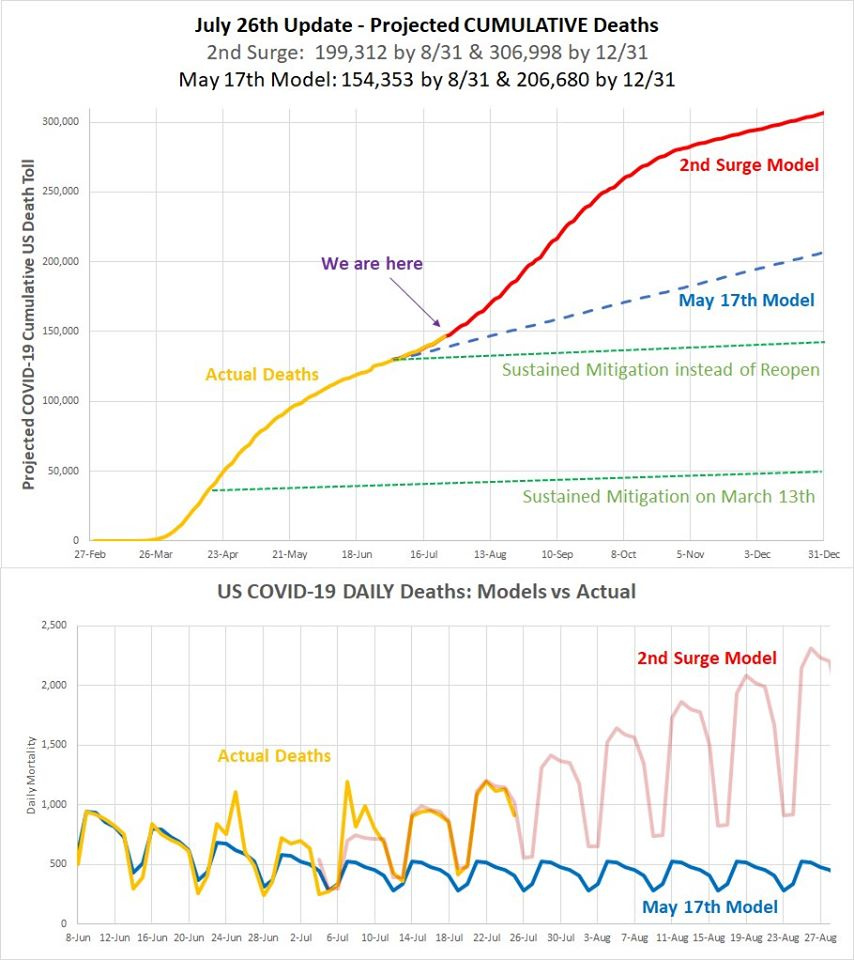
July 26th COVID Update: The 2nd Surge Model Update
Short Version: It’s time to retire the May 17th “Memorial Day” Model predicting when the 2nd surge would appear as a result of reopenings. Bad news, the 2nd surge came at precisely the time predicted. Good news, the rate of increase is substantially slower than the initial spread and while there is still a lot of uncertainty that far out, the 2020 mortality projection has been LOWERED from 373K to 307K.
tl;dr as these things always are. Get ready for a few increasingly awful weeks.
The number of Americans that have died from this pandemic so far has gotten so large that the sheer scale of it has become difficult to fully appreciate. As of Today, IN JUST UNDER FIVE MONTHS, the COVID-19 death toll is nearly than TRIPLE the average US annual seasonal flu death toll and has now surpassed the mortality of every flu season in the last 100 years, behind only the Spanish Flu of 1917-1919. In my continued effort to make these unthinkable numbers of dead more relatable, here are other things smaller than the number of Americans killed by COVID-19 so far:
- Capacity of the Rungrado 1st of May Stadium, largest stadium in the world– 146,000
- ENTIRE Population of Savannah, Georgia – 144,500
- TOTAL US Deaths from World War I – 116,500
- Capacity of the Michigan Stadium, largest stadium in the United States – 113,000
- The COMBINED death toll of the Vietnam and Korean Wars – 92,000
- ANNUAL alcohol related deaths – 88,000
- ANNUAL Suicides and Murders COMBINED – 64,500
Another way to think about this is that there are only about 175 cities in the United States with populations larger than the current death toll of COVID-19. Less than 1% of incorporated cities in the US have populations larger than 146,000. Imagine if a bomb or natural disaster killed every man, woman and child in Savannah, GA? We’d probably do something about that. For more depressing comparisons, please see my updated data visualization comparing COVID-19 to other leading causes of death at: https://public.flourish.studio/visualisation/2335123/
Before getting back to the models, thanks again to everyone who’s visited the Facebook group Angela Bryant and I put together called Kindness During Crisis Group. KDC is intended to serve as a place to tell stories of kindness and humanity during tough times. Seeing all of your posts about the good things happening has really helped me sleep better. It’s been a lifeline for me, thanks for posting!
You may recall if you’ve been following thee updates, way back on June 7th I wrote that by the 4th of July we should see regional spikes in death rates related to Memorial Day events and re-openings across the country if those events caused spread. We would additionally see mortality rates increase that appear clearly in the national data around the 15th of July. The progression of the virus spread has followed these milestones nearly to the day and there can no longer be any reasonable doubt that we are in a secondary surge in the virus with the death rates rising again for the first time since the middle of April.
Although the timing of the estimate for the second surge was very precise, there was no good way to estimate what the rate of the increase in deaths would be back in May. As a result, I used the slope of the initial rise in deaths from the pandemic in the United States as the expected rate of rise in what is now a not-so-hypothetical secondary spread of the virus. I mentioned at the time that this assumption had substantial uncertainty around it. Thankfully, the current death rate is considerably lower than the initial death rate, and there are a variety of good reasons why that might be the case. A fair portion (but insufficient) of the population is wearing masks, social distancing, and generally keeping themselves (and others) safe. Very large gatherings are still rare and places where the most vulnerable are found - elder care facilities for example – are doing a much better job with disease prevention. The disease has moved epicenters from ultra-high population density locations like New York City to areas that are less crowded. Also, medical treatment has become somewhat more effective at preventing deaths than it was in the beginning. All of these contribute to a lower rate of increase in deaths.
2nd SURGE MODEL
I have modeled the increase in the rate of deaths once again using an asymmetric logistic curve based on the initial rise in deaths from this secondary surge of the pandemic. It’s not a ton of data to go on but combined with learnings from the initial rise there is enough to make a reasonable set of estimates. As with the initial projections from back in March, it is difficult to accurately estimate when the current surge will peak. It has become relatively clear from the data to date that changes in deaths tend to trail changes in testing positivity rates by about three weeks. To estimate the peak and trail off of the death rate, the 2nd Surge Model assumes that the surge in testing positivity will stop rising next week, plateau for another week, and then begin to fall again as various states and municipalities begin to lock down again and personal mitigation choices improve in reaction the rising rates of death. There are some data to suggest that this may be happening, but these assumptions are HIGHLY dependent on a rational reaction to the spread of the disease. If leaders and individuals largely take a more foolish, irresponsible reaction to the reality of the situation, the outcomes will be much worse than those in the attached model.
There is some very good news here. The lower rate of increase in mortality means that we can lower the estimate for the number of deaths from COVID-19 expected by the end of 2020 compared to the May 7th model, a reduction of approximately 66,000 dead. The very bad news, of course, is that even with this reduction, we’re still likely to see more than a doubling of the number who’ve already died. The new estimate is about 307,000 dead assuming no effective treatment is found in the meantime.
The Equilibrium Model from previous posts is now being referred to as the “May 17th Model.” The May 17th Model predicted the rise and slow fall of COVID deaths with exceptional accuracy up to the beginning of the 2nd Surge. I am including it so one can easily see the additional deaths we’ve created by not getting the pandemic under control. I have elected not to include a third Fall surge as I have in the past, because I can’t justify where that would start or how bad it would become. Be aware that many epidemiologists are concerned that a Fall surge may also be coming.
It’s important to note that there is nothing whatsoever that can be done to affect the number of deaths over the next three to four weeks. The infections that are responsible for those deaths have largely already occurred. What we CAN do and what we MUST do is to stem the spread of the virus in the community by doing the things we already know we should have been doing. Wear a mask. Wash your hands. Avoid crowds. Social distance. We are now, as we have been from the beginning, only about four weeks from reducing the spread of the disease to a point where we could manage it through contact tracing and containment (deaths will lag as always). It’s what every other modern nation in the world has done other than the United States. It’s quite simple:
• Want to reopen the schools? Wear a mask.
• Want to get a haircut?
• Want to get back to work in the office?
• Want to reopen bars, restaurants, and shops?
• Want to save the economy and reduce unemployment?
Easy! Wear a mask and stop the spread first. Then you can get the stuff you want.
Just one month, America. We’ve managed much worse. This isn’t about violating individual rights any more than requiring everyone drive on the right side of the road. If we don’t there will be unnecessary death. This is a matter of the common good. Even if you don’t get terribly sick yourself, spreading the disease will kill others and prevent a real reopening of the things we miss. 160,000 more Americans do NOT need to die by the end of this year. Most of that can still be avoided if we make the very small collective sacrifices that are needed. For God’s sake, please consider the public good in your actions.
On one of my recent posts, someone said that everything has risks as a reason to not to wear a mask. For example, there’s a risk to your life and the life of others every time you drive your car but you still drive, right? That’s true, of course, but misses the point entirely because it’s about REASONABLE risk. If I were to drive my car down the left side of the road, that risk would not be considered reasonable. Similarly, if I were to choose to drive down a crowded sidewalk, that would not be a reasonable risk. And let’s be honest, there’s no risk to wearing a mask, just maybe a little discomfort. There’s definitely a benefit in preventing the spread of COVID-19 to others.
As always, don’t forget I’m not a medical professional or epidemiologist. I’m a professional statistician with too much on my mind.
Data sources: Johns Hopkins University, CDC, & Wikipedia (for stadium sizes)
9 Likes
@Fatboy8. Is it possible that a portion of the reduced death rate is actually inaccurate and due to potentially fudged or manipulated #s in Florida & Texas? How does he handle these situations. Seems like it could get incredibly frustrating dealing w #s that u know are prolly not real.
Remember when it was said it produced a cytokine storm or nothing? Now it at least looks like we now know why. Would this count as a mutation?
Editing to add that my initial first impression of the virus was that it was an a-hole smoking next to a smoke detector blowing smoke directly into it. The immune system either ignored it or acted like the cigarette smoke was a five alarm fire it had to destroy the house to fix.
Now my current impression of it is this:

2 Likes
Do you have enough data to guess the max daily testing capacity for many places yet?
Definitely nothing to be concerned about. At least they won (in Philadelphia) today!