NY/NJ are going to look different due to a lot of things such as what kinds of people were getting tested back then and treatment options and etc. There was a delay of just a few days back in April.
Does anyone have current positivity % and current 7DMA of cases for every state? @Danspartan?
If I can get those two columns for every state I can put my little eyeball formula to use and guess total US deaths in a month (and WAG at 2 weeks too).
7DMA can be harvested from the state graphs on Worldometers pretty easily. You will have to click through each state though.
Normal unemployment definitely wasn’t intended to be that, but the $600 was. The states are revolted by the idea of paying self-employed and contractors unemployment, which is why they’re not actually providing any of that based on what Iron said. Self-employed and contractors are often always looking for the next gig and those people going around place to place (even though most of their jobs were killed) is very bad in a pandemic obviously.
I don’t agree with this assessment. I think the Dems were trying to slide it through quite intentionally without that message getting out until the money was safely being output. If the Republicans thought that was what they were intending, they probably would have killed it. Several GOP Senators freaked when they realized that’s what was going on, but that’s because they’re so criminally out of touch with what a normal person makes for wages.
This is why they’re so hell bent on opening up and staying open. They know if they shut down they’ll have no choice but to incentivize people to stay home. They’re slowly realizing they’re going to have to do something as every day and week gets worse. The messaging will change super fast from the GOP the minute a high profile Republican dies of COVID. You think Mitch is taking any chances on his health? Not from what I’ve seen.
Your messaging and plan was quite obviously the best move, but I doubt they ever could have gotten that even through the rich Democrats in the House.
MA report from Charlie Baker (R):
- positive test rate still going down/holding steady - 1.7% 3-day average
- 1.25 M tests so far
- hospitalization rate still under control
- money allocated from CARES
- money from state for housing payment assistance
- not happy with CDC data reporting switch
- definitions are unclear → data integrity issues
- lots of new requirements all of a sudden
- let the experts handle it
- what if we start getting upticks?
- do what we’ve been doing - lots of experience by now
- contact tracers have contacted like 115k of 130k people they needed to contact
- lots of incidents of closing a business or office for a few days
- mentioned the 8 towns where they added free testing after local flareups
Link to press conference: https://www.mass.gov/governor-updates
Not bad for a Republican.
I’m always blown away Massachusetts has Republican governors.
Yeah that’s what I’m trying to avoid.
I scraped positive testing % from here: Which U.S. States Meet Recommended Positivity Levels? - Johns Hopkins Coronavirus Resource Center
I don’t. I gave up on total tests quite awhile ago. I tried to come up with a formula to guesstimate total cases but got lost in all the reporting offsets and differences back in the day I think a lot of antibody tests were rolled in.
R MONEY, baby
no regerts
I was playing around with this earlier today. I don’t see any way to get a CFR of 5% - I think it’s substantially less. I looked at both aggregate US data and state of Ohio data (where I live) and I think the most reasonable estimate for CFR is somewhere in the 2-3% range. What I did:
- Calculate 7 day moving average for both daily cases and daily deaths.
- Calculate the ratio, each day, for that day’s (moving average) deaths divided by moving average cases, where I used moving average cases with different lags (concurrent, 7 day, 14 day, 21 day, 28 day)
- Just for reference, included a cumulative CFR rate based on each day’s cumulative deaths divided by that day’s cumulative cases. This is the naive estimated CFR you’d calculate if you were just looking at that day’s up-to-date data.
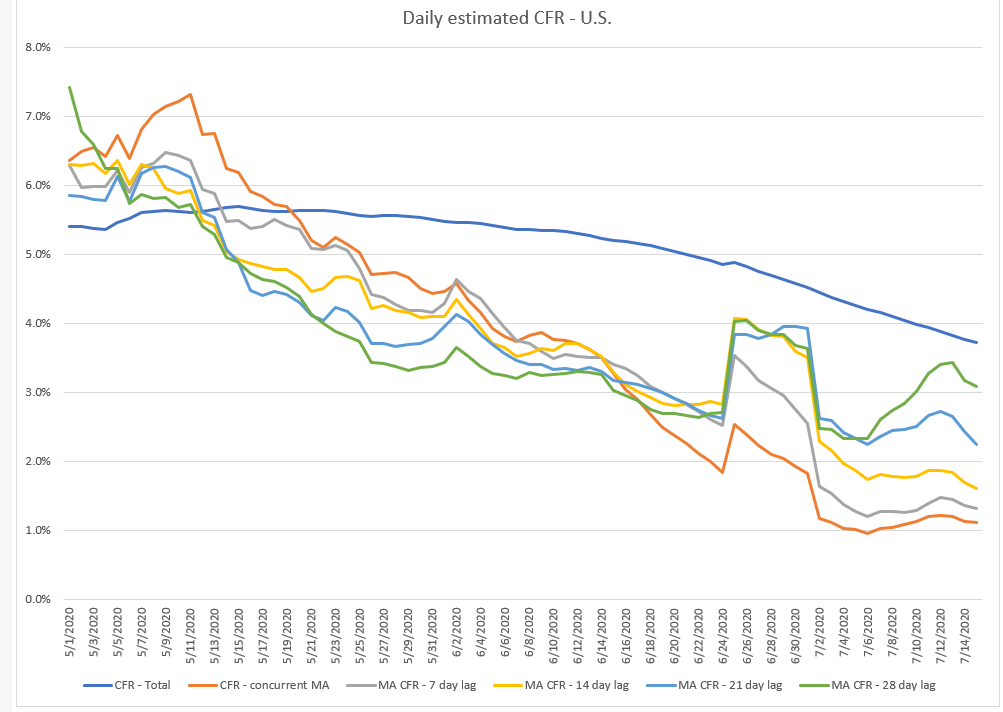
I feel like the 14 and 21 day lags are the ones to look at, but that’s just gut instinct. What you get is a steady decline over time, but in the last week or so it’s leveled off at around 1.8%-2.5%. (The big blip in late June is the result of a big data dump that happened, but I don’t recall the details.) And no matter what lag you look at (of the 7-day increments I chose, at least), you don’t see observed CFRs at the 5% range since mid-May.
Same is true in Ohio, just noisier lines since the numbers are smaller:
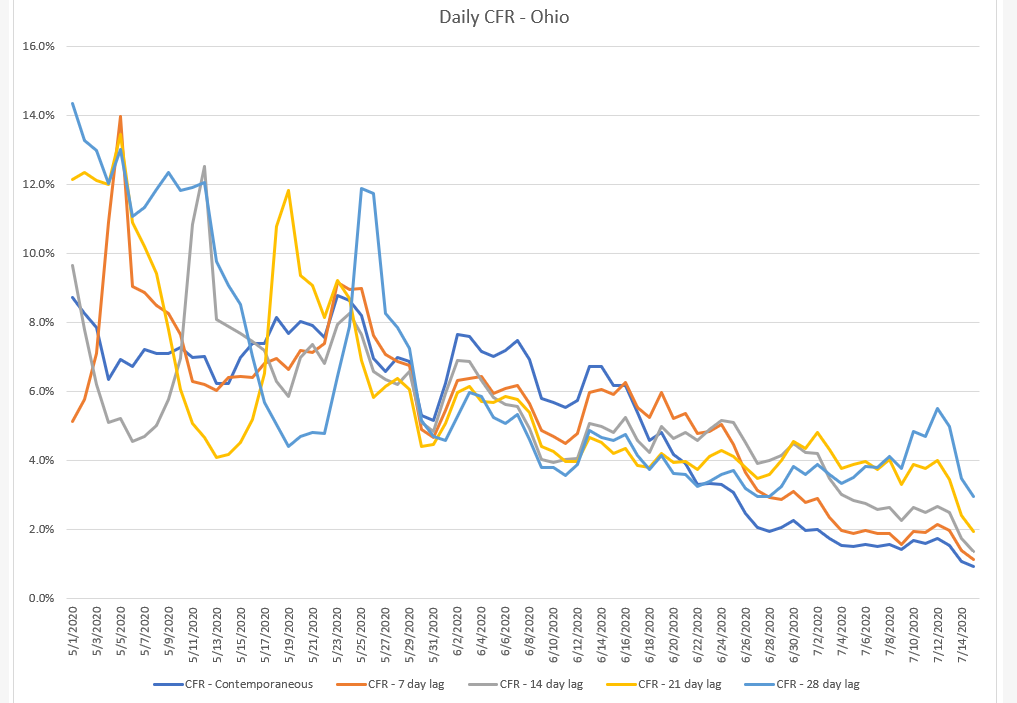
Numbers are higher here, but it’s hard for me to believe that the current CFR is above 4% in the state. I think a better guess is probably 2.5-3%.
So if we’re consistently hitting around 70k daily cases, I think we’re looking at an upper bound of about 1.5k-2k daily deaths in the next month.
Edit: Didn’t realize that’s exactly what @WichitaDM came up with as his estimate. But mine is more of an upper bound. I think my actual expectation of average deaths in 3-4 weeks is probably 1.2k.
Last I looked the bigger current states were running about 2% cfr about 10 days offset from cases. But higher in more northern states which frustrates me because the only reason for different offsets has to be reporting (legit and non-legit) reasons.
I found total tests for last 7 days by state here: https://www.cdc.gov/covid-data-tracker/index.html#cases (in the little box)
I’m ciphering as we speak…
| State | Pos% | Pos Cases 7DMA | Deaths/day in a month |
|---|---|---|---|
| Alabama | 16.64% | 1732 | 72 |
| Alaska | 1.78% | 58 | 0 |
| Arizona | 23.96% | 3249 | 195 |
| Arkansas | 13.61% | 722 | 25 |
| California | 7.30% | 8309 | 152 |
| Colorado | 6.73% | 434 | 7 |
| Connecticut | 0.79% | 75 | 0 |
| Delaware | 4.10% | 72 | 1 |
| District of Columbia | 1.62% | 55 | 0 |
| Florida | 18.77% | 11057 | 519 |
| Georgia | 15.49% | 3421 | 132 |
| Hawaii | 1.84% | 27 | 0 |
| Idaho | 14.08% | 497 | 17 |
| Illinois | 3.07% | 1039 | 8 |
| Indiana | 8.49% | 615 | 13 |
| Iowa | 9.23% | 541 | 12 |
| Kansas | 10.73% | 474 | 13 |
| Kentucky | 6.37% | 394 | 6 |
| Louisiana | 10.32% | 1997 | 52 |
| Maine | 0.79% | 16 | 0 |
| Maryland | 5.40% | 602 | 8 |
| Massachusetts | 2.40% | 249 | 1 |
| Michigan | 2.60% | 623 | 4 |
| Minnesota | 4.26% | 602 | 6 |
| Mississippi | 13.48% | 887 | 30 |
| Missouri | 5.97% | 644 | 10 |
| Montana | 4.18% | 107 | 1 |
| Nebraska | 6.14% | 222 | 3 |
| Nevada | 15.13% | 869 | 33 |
| New Hampshire | 1.85% | 23 | 0 |
| New Jersey | 1.36% | 320 | 1 |
| New Mexico | 3.99% | 261 | 3 |
| New York | 1.14% | 410 | 1 |
| North Carolina | 7.43% | 1994 | 37 |
| North Dakota | 5.54% | 100 | 1 |
| Ohio | 6.20% | 1304 | 20 |
| Oklahoma | 9.37% | 639 | 15 |
| Oregon | 6.81% | 323 | 6 |
| Pennsylvania | 5.40% | 797 | 11 |
| Rhode Island | 3.46% | 62 | 1 |
| South Carolina | 18.49% | 1905 | 88 |
| South Dakota | 5.60% | 59 | 1 |
| Tennessee | 8.91% | 1868 | 42 |
| Texas | 16.12% | 8829 | 356 |
| Utah | 8.93% | 598 | 13 |
| Vermont | 0.94% | 9 | 0 |
| Virginia | 5.75% | 920 | 13 |
| Washington | 5.90% | 729 | 11 |
| West Virginia | 3.54% | 121 | 1 |
| Wisconsin | 7.15% | 827 | 15 |
| Wyoming | 4.81% | 35 | 0 |
| USA #49 | 1957 |
Ok here’s what I got for deaths in a month based on normalizing at 20% positivity = 5% CFR (so 5% positivity = 1.25% CFR).
Caveats:
Positive cases is dividing the last 7 days by 7 - so it’s gonna be low, which makes this low. Although eyeballing the big boys - TX/AZ and FL - they’ve all leveled off a bit in new cases. Probably fudging, which would of course make deaths low, assuming they don’t fudge that too.
Also for the low positivity states there is probably some floor of CFR for 2% or something. Using 2% as a floor for CFR, I get 2063 daily US deaths. So not a gigantic difference.
Try covidtracking.com/data. They’re behind some places where data can be pulled, but CDC’s numbers just looking at 4 places aren’t as high as that site. Florida is wayyyy different for CDC vs. covidtracking (covidtracking is well below the CDC number).
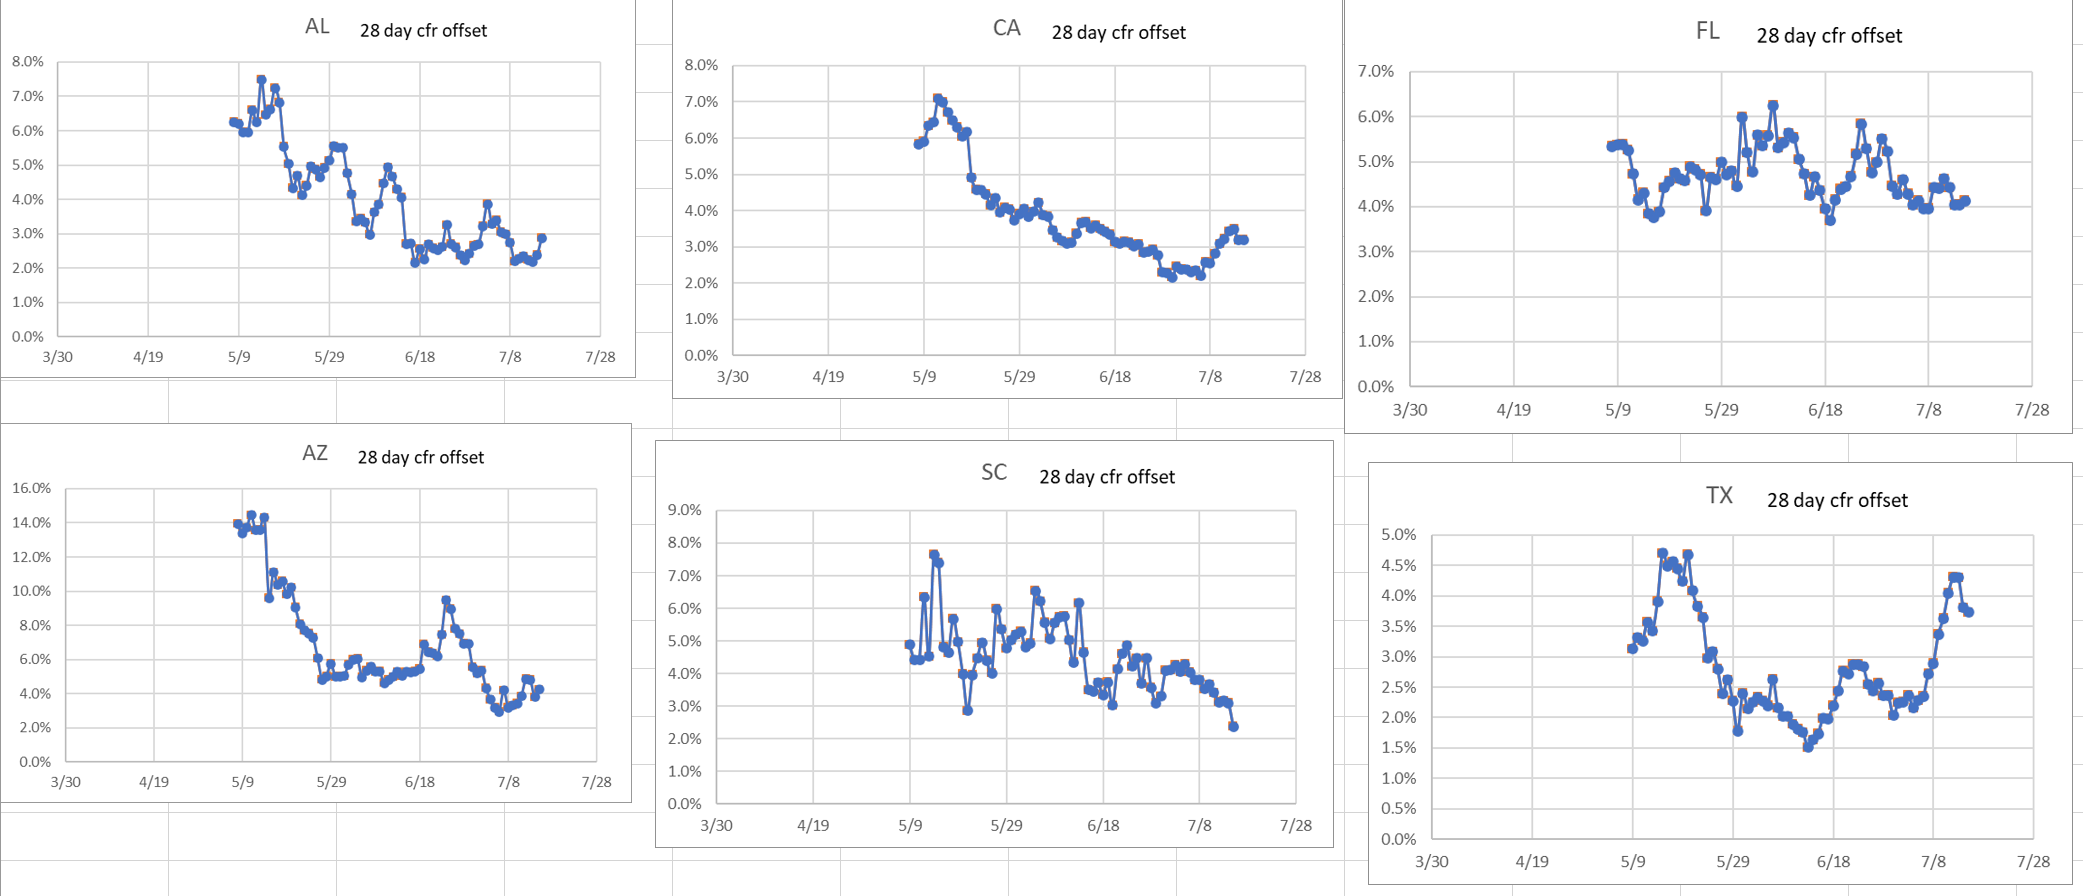
Just grabbing six of the bigger current states I would eyeball a 28 day offset of 3.5%.
This is 7DRA 28 days ago vs 7DRA deaths today (and so on back In time).
So 70,000 x .035 is 2,450.
If I go off National the plateau of low 20,000 per day ended about June 15 And has been a more or less linear climb of 10,000 cases increase per week. So going forward we should expect the 7DRA deaths to go up about 350 per week or 50 per day.
Of course as we started hitting the very high positivity rates, the odds that we are missing more cases in real time is increased, so we probably can assume that cfr to turn back up a point or two. So yeah 2950 makes a lot of sense to me. 2400 is likely near the bottom of the range.
Edit I blame you if I can’t sleep tonight. The math brain is hard to turn off.
Italy averaged 750 deaths/day in its worst week, NYC got up to 1000 deaths/day. It’s gonna be insane if Florida gets over 500 deaths/day
Especially because their curve isn’t a spike, it’s a plateau that’s going to go on for who knows how long. So it could be a month or more over 500 deaths/day. NYC and Italy had a sharp spike, not a giant plateau.
Same with Texas as Arizona, although AZ may be in a slow decline in cases. But who the hell knows if that’s real.
That’s pretty much exactly why I think they eventually have to shut it down. Those states are so far away from R =1. Even if by some miracle they got to that point they are permafucked with the current level of infection. The only surefire way we have seen any place get to R<1 and stay there is shutting down until cases are very low and diligent test/trace.
There is basically no chance these states have anything besides an absolute slaughter with 90% of things open and being full of right wing mouthbreathers.
It’s probably real based on SDI changes over the last 3 weeks.