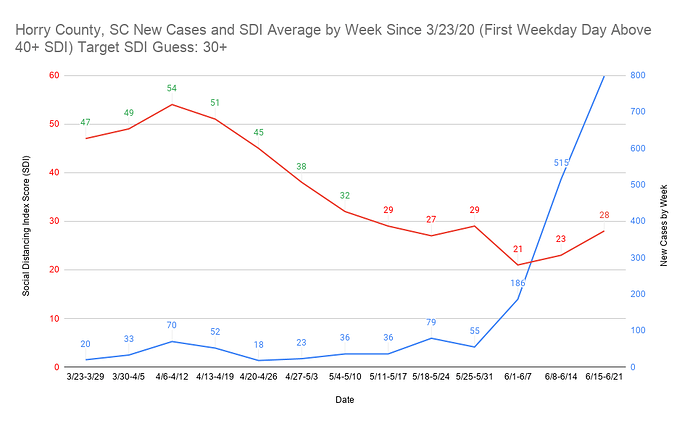
Can u do it for Horry County SC we went from a 7 day average of-6 to 150 in no time. Record 214 today
A lot, not all, of this EU tourism will be by car, not flight
So it would be similar to the USA which has never closed domestic flights? Except Euro’s domestic flights have closed for last 3 months.
Euro might be like US today, in say 3 months time, or may detect any spread earlier all also shut down again
So NY hit it’s peak daily cases (over 11k on April 4 and April 15), and peak of daily deaths (around 1000 per day) between say April 7 and April 17.
Florida is pushing 10k today, but only 26 deaths and a recent peak of 74.
Surprised to see the peak of deaths didn’t really show a huge lag in NY, at least per Worldometer.
We seem to be expecting that daily deaths in Florida will trend upward, which seems reasonable, but it definitely doesn’t seem to be following the same pattern. By the time NY hit 9k+ daily cases, they were seeing 600+ daily deaths.
It took NY about 2 weeks to hit the huge ramp up that seems to similarly be taking about 2 weeks in FL, but yeah those deaths.
Are they really under-counting deaths by 20x? Could it really be true that NY did end up executing the elderly in nursing homes, and without that the death toll would be been so radically decreased?
I know it is unknowable, but it seems very strange to me that the huge case explosion hasn’t been followed with a corresponding explosion in deaths. Fishy? Science?
Could be some combo of more testing, this leading edge of this wave skewing young/healthy, summer leading to milder initial does and milder cases, behavior in general leading to milder initial dose, super at-risk people isolating better, better treatment protocols, probably some other variables.
In NYC you basically had no testing, no one had changed their behavior at all yet, no one at risk was taking extra precautions, cold/dry air–>dry heated air, lots of immigrant and blue collar families living with older relatives who got a massive dose from the youngs.
Just speculation - but I see a ton of potential factors that might reduce the death/ICU rate. I can’t think of any that should make the rate worse for the second wave.
I could definitely see Florida/Red states under counting deaths by nearly 20x. They aren’t reporting anybody with any comorbidity which is a big chunk of deaths, anybody from out of state, plus they’re straight up removing deaths if that former person who used to do stats is to be believed which I do.
10x infected to confirmed ratio overall for the life of the pandemic in the US (when the vast majority of cases happened in March/April most likely) is possible, but there’s reason to think it’s much lower right now than it was at the beginning.
Do you think we’re still only confirming 1/10 infections when the %positive rate has dipped from 30% to <10%?
(Recent increase in %positive rate notwithstanding)
Don’t you think a pretty good explanation for the decline in the CFR is that we’re now picking up a lot more than 10% of infections?
Test Rates in April were a lot worse, so most likely they were „caught“ later and in worse conditions, so it makes sense that out of 9k diagnosed people in early April in NY more people would die and they would die faster than the 9k today in Florida.
The 9k today ate probably 12-15k in reality, whereas 9k in April were possibly around 60-70k (pulled those numbers right out of my ass, but I hope you get the picture)
[quote=“Danspartan, post:8441, topic:1764”]
PEOPLE
[/quote]my theory is their lives are so miserable they don’t care if they die and Betty Jean gets 1/2 the $$
Florida, Georgia and Texas have always had extremely suspicious death stats. The recent numbers are no exception. The fact that 35-40% of all new cases are coming from these states now means if they are continuing to manipulate death stats then the deaths are not going to change much as cases rise exponentially.
In other words at the beginning it was blue states driving the action and they are more likely to be honest with the stats than red states who are now driving the action. Also what suzzer said. There are reasons the mortality rate should drop a little.
It’s only up to date through June 21, which is fine because the effects of SDI score lowering show up well before then. The next dump of data to create another week probably won’t come in until Wed. or Thu.
It looks like people are starting to play it more safe again as of the last data range. I wouldn’t be surprised to see the SDI back above the target of 30+ in the next data set. The problem appears to be that it got down really low (21 week of 6/1-6/7) before changing and that might present 3-4 weeks at least of really bad effects starting two weeks later (6/15-6/21) no matter what goes on with SDI going forward. I wouldn’t be surprised to see 8 weeks of effects from the 6/1-6/7 and 6/8-6/14 SDI scores with the measurement of that 8 weeks starting the week of 6/15-6/21. Stay safe.
Also, I can do a graph like this for any county in the country in about 15 minutes, so if there are specific ones people want to see let me know.
People in NY were dying before their results came back from the lab 5 days after they were swabbed. Hospitals that have rapid tests get results in a few hours. Most inpatient tests come back the next day at the latest.
Maybe - but it’s still probably in the ballpark of 10x, which is good enough for any kind of approximation you might want to use it for. You’re never going to know it more precisely anyway, right?
All interesting stuff, lots of variables at play.
Do we think we’ll see FL deaths ever hit the 600-1000/day level?
Do you know average current Washington test–>result?
Somebody needs to do like a ranking of how accurate they think each states cases/deaths are because these numbers make no sense at all next to each other
As a piece of background, when I was trying to find reliable sources of data about a month into the pandemic there were several places that were very concerned about the reliability of Worldometer’s data. They didn’t like that they refused to reveal their data sources at the time. Has that changed?
All the sources are listed on the far right column in each data table.
I don’t think so, I read one of those articles too but I just like worldometers for its simplicity and I haven’t found anything better that has stuck in my mind. Can someone post other good sites they use to help keep track of all these numbers?
This one is good for the US.
covidtracking.com (this is probably the most reliable daily case data but it’s lower than other places)
coronavirus.1point3acres.com (for general quick look and active cases)
https://data.covid.umd.edu/ (tons of granular data but on a delay)

