What I caught very early on is screwing up the response didn’t lead to more cases, it led to an extremely high death rate. UK spent a week running toward herd immunity, so that’s why their rate is so high. Sweden is the same. Mexico had outdoor soccer games with crowds after the U.S. was being hammered and also has an extremely high death rate. I think if you go country by country you’ll find a reason for the high death rate whenever there is one. Again, poor behavior at the front leads to high death rates. It took a long time for the U.S. to get above 1.2 percent, but when it happened it happened fast. The only place that didn’t make sense when I was looking at that was Belgium. I thought they had a good response, but their death rate was off the charts. I never looked for a reason.
======
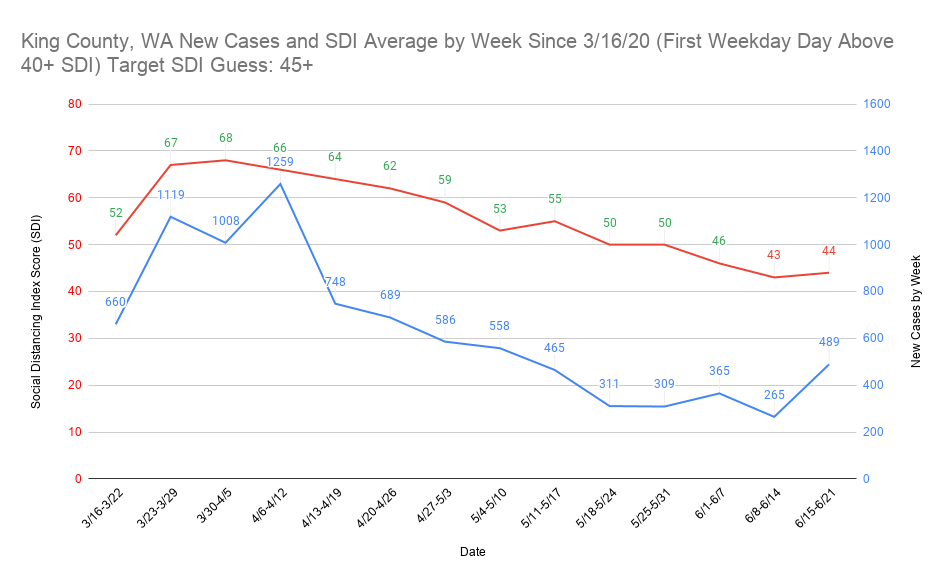
As for the protest running joke, I think this graph is possibly what an actual protest case increase looks like in King County, WA. Again, due to SDI, the protests overall probably aren’t going to make huge effects on caseloads. Where it will most likely be noticed is in increases where places are currently doing well overall. I think the protests will be a blip on the data anywhere that has a significant amount of cases.
Any disagreement this looks like a protest spike? I think the real target for King County SDI might be 40+ and not 45+, which is why I think it’s a protest spike.
Where can I find weighted population density by state? I’ve found population density up to 2015, but that’s it so far.
Are you able to check the UMD site and see if there’s a way to scrape that data or some underlying place they’re keeping that data? The biggest pain in the butt about that site is that it doesn’t appear to have a way to get the data other than manually.
As a test case, Nevada might be good to try to do an SDI tracking project. There aren’t that many counties in the state and I think it would be possible to set up pretty accurate SDI targets with how widely its population density varies.
I need probably a few more days to organize everything, but what specific data do you want that I might have and where do you want me to put it? I have new cases by day since 3/11, new cases by week since 3/11, statewide order dates from the beginning of the pandemic, how far ahead or behind response was to my flashpoint of 200 new cases in a day, SDI by day and state since 3/11, SDI weekly average by state since 3/11-3/17, SDI weekly (with new cases from same site) by county in the 10 most populous places in the U.S. plus a handful of other counties, new cases/testing by week for the last 5 weeks, and I’m also tracking active cases every Sunday (not sure how reliable this is) for the last 5 weeks or so.
I have a lot of stuff (was looking at all this from a different angle), so anything from that you think might be useful I can give to you if I have it. I just might need some time to organize it.
We have memory B cells, which can bind their designated antigen and then stimulate antibody production. You don’t need to have antibodies in your system at all times. You don’t still have measles antibodies floating around in you from that MMR vaccine years ago.
The caveat, of course, is that we’re not really sure how this will manifest with SARS-CoV-2.
Any thoughts on how the shutdowns would have affected number of deaths? My gut says that we’d see less, so that real Covid deaths are higher than that amount.
Looking more and more like activating T cells is going to be the key to creating a vaccine. Also, it looks like surviving SARS is the best way to protect yourself from COVD19
We then show that SARS-recovered patients (n=23), 17 years after the 2003 outbreak, still possess long-lasting memory T cells reactive to SARS-NP, which displayed robust cross-reactivity to SARS-CoV-2 NP. Surprisingly, we observed a differential pattern of SARS-CoV-2 specificT cell immunodominance in individuals with no history of SARS, COVID-19 or contact with SARS/COVID-19 patients (n=18). Half of them (9/18) possess T cells targeting the ORF-1 coded proteins NSP7 and 13, which were rarely detected in COVID-19-and SARS-recovered patients. Epitope characterization of NSP7-specific T cells showed recognition of protein fragments with low homology to “common cold” human coronaviruses but conserved among animal betacoranaviruses.