COVID-19: Chapter 4 - OPEN FOR BUSINESS

He does. It’s written on the first image. Median time from first symptoms to death is 14 days.

He is of course right that hospital admissions and fatalities are important to watch, but I’m not sure what his point is with that first graph. The endpoint is 21 June, therefore hospitalisations (which have a 7 day delay from first symptoms) reflect the testing numbers on 14 June. If you look at 14 June, there wasn’t much more than an 11% rise in reported cases over baseline. There’s now an 11% rise in hospital census. Isn’t that roughly what we’d expect to see?

1 Like

I will say, and maybe I’m ponied here, that this graph is suggestive that some of the rise in Florida is driven by better testing. This is the mean age of positive test results.

There’s no reason for the mean age of cases to actually decline, instead this reflects better detection of mild cases. That said it’s a fairly modest decline.

2 Likes

OPEN FOR BUSINESS is more likely to attract people in lower risk categories than high risk categories? And people who are engaging in OPEN FOR BUSINESS are more likely to get pozzed?

Yes and then they go visit mom and grandad and …

1 Like

I do not understand the morality of someone being on the “its not that bad” side of a pandemic that has killed almost half a million people.
It is so, so much worse for these people to be on Twitter than the ones calling others a fucktwit.

1 Like

Let me preface this by saying that anyone named Rational Skeptic is obviously a clown and you shouldn’t listen to them. It’s clear that places like Florida that are going YOLO are resulting in massive increases in deaths.

Having said that, there is a legitimate disparity between deaths and new cases. The # of new cases had clearly leveled out by June 1st. We’re not seeing anything like that in the number of deaths per day three weeks later, it’s continuing to decline. What’s going on? We know testing is increasing dramatically and it’s axiomatic that more tests = more cases as we detect more people with mild symptoms. It’s also possible that new treatments/procedures are leading to fewer fatalities. It’s also very clear that the reopening is leading to increased spread of COVID.

I AM NOT SAYING ALL OF THIS IS DUE TO INCREASED TESTING ALONE. But it’s clear that increased testing is absolutely playing a role. What I’m basically saying is that there are many confounding factors at play, no one should feel confident making any big dick-swinging predictions.

Yeah, like:

image

I am a rational skeptic, I have named myself after… an Egyptian god. Like skeptical people do.

1 Like

Ethical skeptic dammit! There’s nothing rational about it.

1 Like

My life would undoubtedly improve.

1 Like

Yeah. It does seem that increased testing is playing a role. I tried to follow that Ethical Osiris guy’s modelling for a while but he has way too many moving parts in there. I don’t think it’s actually possible, epistemologically, to figure out what proportion is testing and what is real COVID increase and so on. It’s complicated and the facts can change very fast.

I suggested that to her. She’d made a lot of friends here and she was a big time skier so she wasn’t happy to have to go. But there were family issues back home she’d been avoiding by being here and they put enough pressure on her she felt obligated to return after she graduated. I actually like SLC, though not so much in the Winter. The inversions suck.

Update. The person at my job tested positive. They’ve called in a company to do a “thorough sanitizing” and the building is off limits for one week, at which point we go back to work. When we were sent home we were told it would be for two weeks.

So it certainly looks like outdoor gatherings are not a big deal, unless anyone can discern any effect of any of the BLM protests on COVID numbers. For example this was Philadelphia, June 6:

image

Results:

Absolutely nothing. It’s the same story nationwide, just no correlation at all between protests taking place and case numbers. Also the same story in Australia, where zero COVID cases have been traced to the protests.

Becoming clearer and clearer that the way you get it is prolonged indoor contact, end of story.

8 Likes

Well that or the 5G people are right, I guess.

1 Like

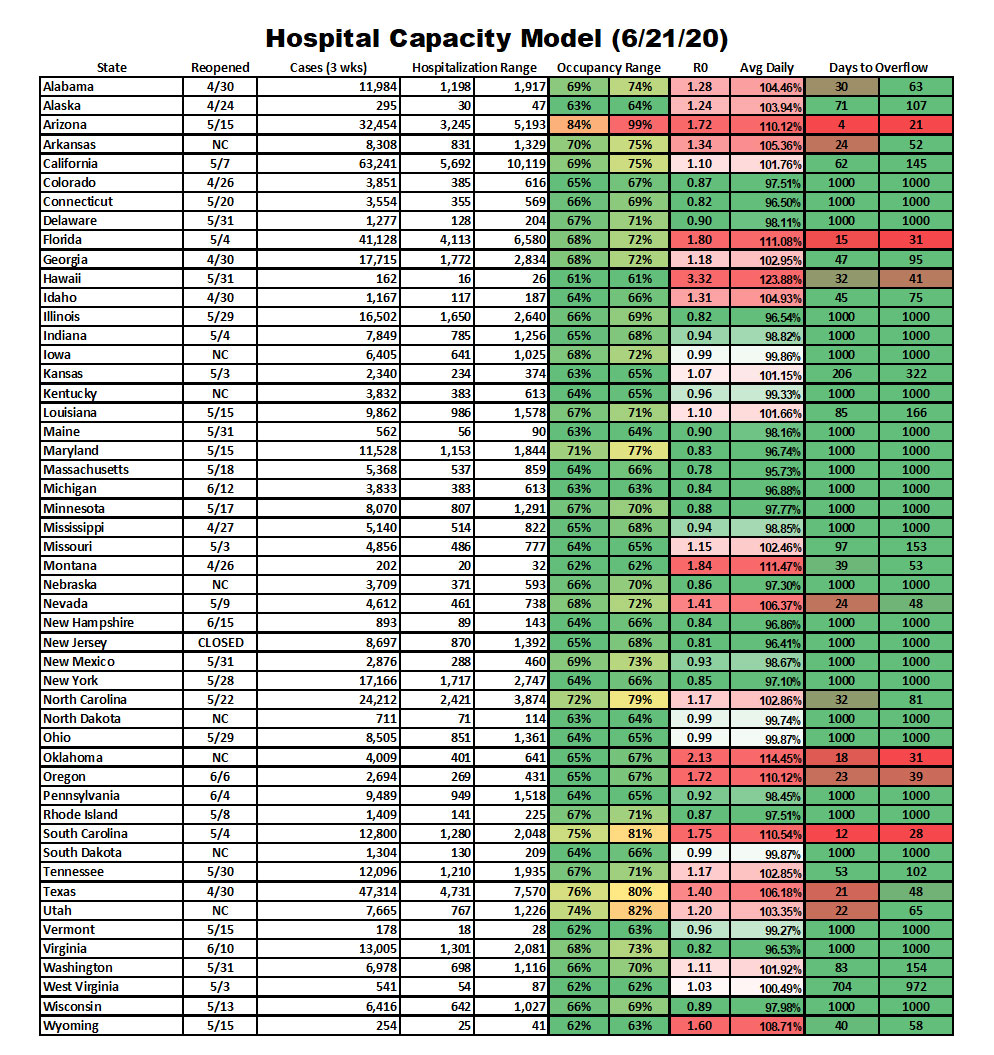
The model appears to be working. For example, I have Florida projected at 68% to 72% capacity, and their dashboard says 72%. Texas is holding up as well. Florida has actually expanded its hospital bed capacity, though. It was officially 55,800 as of last year. It’s now about 59.5K, so I’ve updated. That’s the type of thing I’m finding as I drill down into a state’s specifics, which I can then import into the model.

The Ugly

The little bit of good news for Arizona is that their R0 is down slightly, but it’s still too high to save them. I continue to believe their only hope to avoid overrunning their hospitals is to surge the capacity somewhat dramatically. Don’t let their decreased case numbers fool you, the Sat-Sun case totals were low last week too - and these are way higher than those.

South Carolina has 12-28 days left, down from 14-32. Of course, three days have passed so this is roughly on the same track. Their R0 ticks up slightly from 1.68 to 1.75. Could just be noise, but it doesn’t really matter. They need that to be dropping in a hurry. If they’re not already out of time to flatten their curve, they’re close. They’re also going to need to surge capacity, most likely. Horry County (Myrtle Beach) is at 81% capacity officially as of Saturday. I haven’t run their numbers yet, but the curve there is steep so I’m guessing they’re 10-12 days away from overflow in that county.

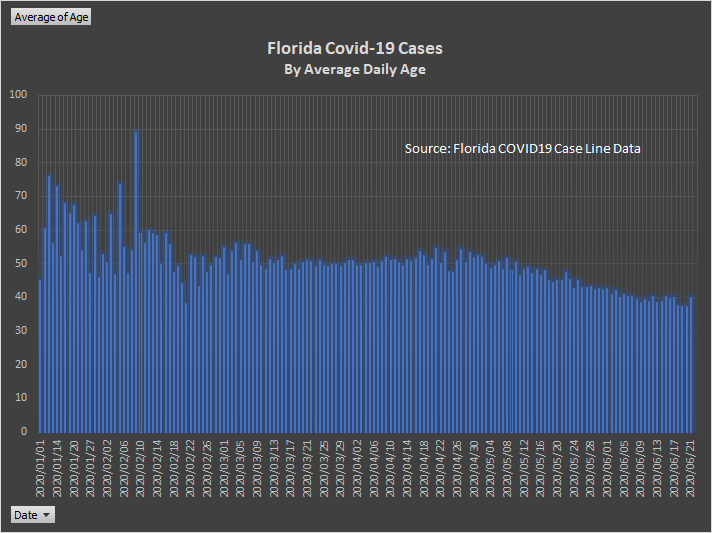
Florida continuing to be an area of increasing concern. In three days they went from 21-39 days away from toppling the hospitals to 15-31, with their R0 going from 1.61 to 1.8. I’m tracking Orlando’s rate of spread, they were at 2.54, they’re now at 3.76. Yikes.

Orlando’s hospital bed capacity was reported to be over 80% a week ago. This would put them way out in front of the rest of the state, and with a higher R0. That said, they also are reported to have fewer cases per 1M people than the state overall. Maybe their hospitals are importing cases from surrounding counties? Their largest hospital (1,185 beds) is at 78% capacity, their second largest (611 beds) is at 99.18% capacity and their third largest (304 beds) is at 89.8% capacity. Orange County overall has about 500 beds left, with an estimated 2,593 active cases. 1,600+ of those cases are in the last seven days, which means most of those probably haven’t hit the hospital yet. I think Orlando has about a week at this rate before they have doomed their hospitals to needing surge capacity, which means about 2 weeks before that manifests itself. That’s unless their R0 comes down.

The Bad

Oklahoma had an eventful weekend, going from 3,084 active cases to 4,009. Almost an entire Trump rally in Tulsa’s worth of cases. A parscale, if you will. From 36-57 days down to 18-31. From a 1.47 R0 up to 2.13.

Texas is gaining momentum, from 29-61 days down to 21-48. R0 jumps from 1.31 to 1.4. However, they appear to be scaling up their surge capacity. It’s a race against the virus, but at some point they’re going to run out of room. Houston’s R0 jumps from 1.24 to 1.35, their total number of beds in the county increases, but they’re still down to 17 days. Dallas is holding pretty steady in R0, slightly down to 1.19, and they are 37 days away from overflow.

Nevada continues to experience a gambling event. 36-69 days drops to 24-48, with R0 jumping from 1.28 to 1.41. I haven’t dug in yet on the specifics, but if the trends with FL and TX hold, Vegas is probably < 24 days away.

Idaho gets itself into the mix of states to keep a wary eye on. They went from 97-157 days out to 45-75, with R0 going from 1.14 to 1.31.

Montana still green, but their R0 jumps from 1.44 to 1.84. They won’t be green for long if they keep that up.

The Good

Oregon starts to see a shift back in the right direction. They go from 20-33 days to 23-39, with R0 dropping to 1.72 from 2.02. They need it to keep coming down, though.

Hawaii gets a big downward bump in R0 as we’ve been expecting, I expect that to continue and get them into the solid green within a week or so.

North Carolina actually moves a couple days in the right direction, they continue to confound me. Although they did reopen later than most other southern states (they have a Democratic governor). Elections matter.

Utah a slight bump in the right direction, Wyoming safe for now but with a bad R0 of 1.60.

11 Likes

Well, mask usage at the protests was probably 90% or higher, so I think the jury may be out on prolonged outdoor contact without a mask.

The lack of a spike has led me to conclude that golf is safe, so I’ll be back out on the course this week for the first time in a super long time.

1 Like

I don’t understand what my winrate has to do with Covid.

2 Likes

More rational to worship an Egyptian god than to be Christian, since many of the stories about Jesus were lifted directly from Horus.

So he’s got that going for him…which is nice.

Lots of mask wearing may be different than the huge err good size err couple thousand folk “crowd” hanging out in Tulas.