Kinda like a strep swab but longer. Very awkward but no effects after
U had to do yourself? Sounds like Cvs mi clinic
Yeah it was shove it up my nose. They were watching and thought I did a good enough job on my right nostril. Left nostril not so sure, but I swear I was shoving it. I dont know, but felt better doing it to myself than someone else.
Jfc first world pharmacies w self corvid testing. How many people try and can’t do this to themselves U got balls buddy u have symptoms or proactive
Proactive. Considering doing something dumb like visiting parents in a different state. Getting tested when free was the least I could do.
1 Like
I’ll show my work tomorrow and seek a little UP style peer review on my methods. The key assumption I need to think a little bit more about in order to estimate current hospital bed demand is counting active cases in states that do not release that data by removing all cases over 1 month old.
I’ve run four states so far… Obviously there is variance city by city, but this should give a broad overview. Here is the multiple of cases each state can weather before they tip over, assuming they can expand hospital capacity by 50%. I need to refine my numbers to continue to remove cases > 1 month old, that’s not done yet.
Arizona: 1.93x
Texas: 6.3x
Georgia: 1.94x
Florida: 3.49x
I don’t know how to take the R0 numbers that @Danspartan calculated and use them to see how many days we are away from these multiples being hit. Dan, is there a formula I can put into Excel to turn R0 into a doubling time? Or to take those multiples and the R0 you’ve estimated, and turn it into an expected number of days until tipover? Perhaps then with a 95% confidence interval?
One interesting thing right away is that, by the numbers, Georgia appears to be in slightly worse shape than Arizona, which is surprising given that we aren’t hearing a ton about it and given that we suspect a lot of numbers being fudged in Georgia. But their R0 remains very low in current conditions, somehow, someway, some fudging? Still, we’re not hearing about hospitals approaching capacity. My guess is they’re getting by on a younger population, but that the large-scale protests there will be very problematic.
Arizona hospitals are saying they’re at 80% capacity in some cases, whereas my spreadsheet would suggest they’d be at 77.6% statewide before factoring in expanded capacity - so that checks out.
The main thing that comes to mind is Arizona having an older population, so I checked. 17.5% of the population in Arizona is 65+, whereas only 13.9% of Georgia’s population is. So we’re probably seeing a higher hospitalization rate per infection in AZ than in GA.
While I’m looking at this, Texas is 12.6% and Florida is 20.5%. So expect Florida to be in trouble without further action - they’ve got less than two doubling periods before they’re in very bad shape (even at expanded capacity). Dan has their R0 at 1.23 and he says that’s about a 3-week doubling period, so we’re currently looking at Florida being in tipover range in about 6 weeks.
Of course that’s also without additional upward lurches in R0 based on activity, and they are trending upward in R0 based on Dan’s charts.
Does anyone have a list of states by reopening date so I know which ones to do first?
2 Likes
Did this get mentioned here?
I’m sorry to inform you that your pony resigned from the Pony Express.
Sure but his resignation letter still hasn’t reached the destination.
You can do a daily multiplier with the following:
In excel
Rd=exp(ln(R0)/5.6)
For 1.2 it’s 1.033093
So then take today’s case number x 1.033093 to get tomorrow’s number. Rinse repeat.
Again these are not the official calcs which have a lot more complexity. I’m just using a reduced form that rolls all the inputs into one simple equation. Seems to work. I’m not trying to derive R0 from first principles of natural rate of spread, environmental factors like masks, social distancing, population density, etc. instead I’m calculating from observed case rate changes. “Empirically determined” if you will.
1 Like
You can also get there directly from
Rd^t=C
t=days until capacity hit
C=capacity factor as you describe
t=LN(C )/LN(Rd) in excel format
So for our example of Rd=1.033093 and 1.93x capacity before limit hit
20.2days=LN(1.93)/LN(1.033093)
3 Likes
https://twitter.com/nowthisnews/status/1271203807712575489
Mother of God
This is like several levels of stupid below anything I’ve read on Chiefsplanet (stupid, not racist). I think we forget sometimes just how mind-bogglingly out of it a lot of the general public is on basic science.
1 Like
Looks like decades of defunding education is really paying off.
11 Likes
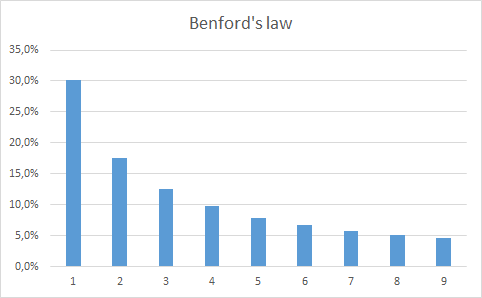
[QUOTE=Morphismus;56222858]Do you know Benford’s law?
More precisely, if you have a set of numbers like population of cities in a country, or the areas of its lakes, and you look at how often 1-9 occurs as a leading digit, respectively, it should look something like this:
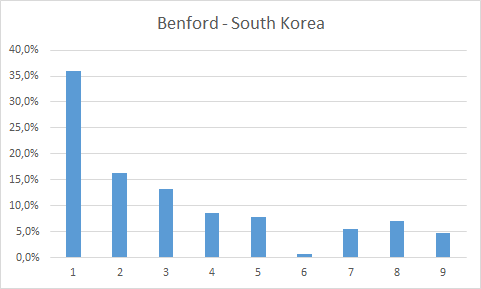
You can use this to check if a set of numbers is plausible, e.g. I read once that they can sniff out doctored tax declarations with this. So I thought to analyze the number of daily new Covid cases by country that way, and got some interesting results. Let’s get started with the country whose numbers everyone trusts the most: South Korea:
That’s pretty much standard Benford, except the 6 is under-represented. But the data sets we look at here are relatively small (128 here, around 100 in general), so some random deviation is to be expected I guess.
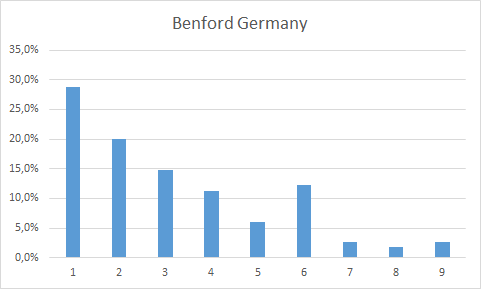
So who’s also good at testing, and known for its impeccable numbers? Germany! :laugh:
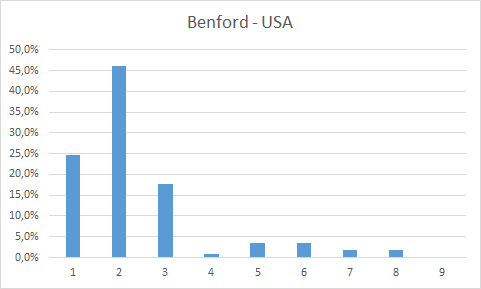
A bit more different, but still OK I guess. I’m no expert on Benford’s law, but am kinda fascinated by it and also like to play with spreadsheets, so I looked at quite a lot of these distributions from different areas over the years. In my experience, you have often deviations, but the rough shape is always there. And if you have a clear deviation from the basic shape there might be an explanation, like in the case for the US:
Here the 2 is over-represented, but it makes sense as the US daily new cases hovered just above 20k for quite some time, so I would call this still fine. Here are some more distributions where Benford’s law clearly shows imo:
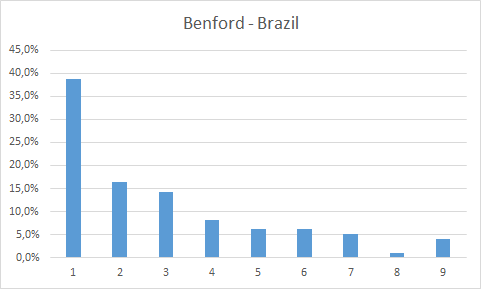
Brazil also pretty much standard Benford.
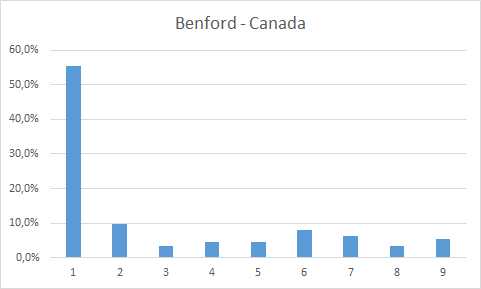
Canada’s numbers hovered just above 1k for a while, so here the 1 is over-represented.
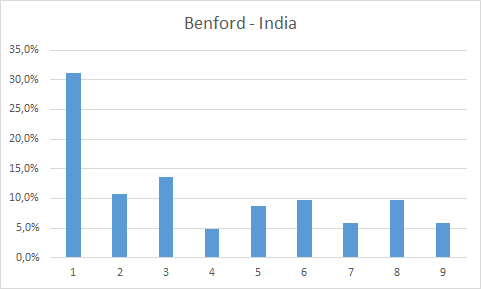
With India it gets a bit wobbly now, but still close enough imo.
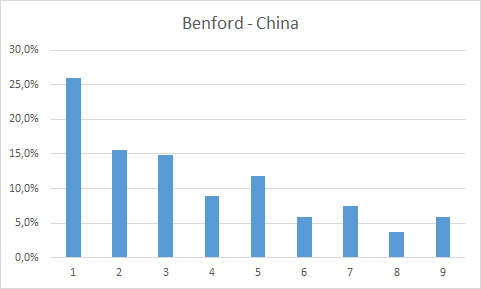
If China doctors their numbers, they at least look that they roughly obey Benford’s law. :D
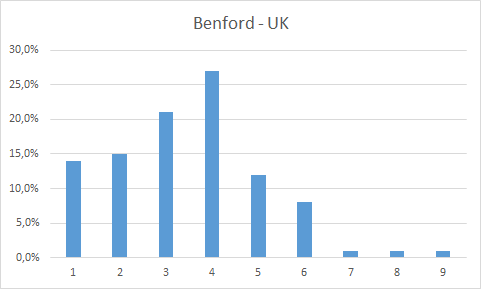
Some graphs look a bit more strange, but are still somewhat OK:
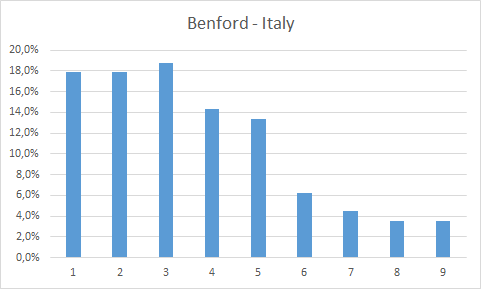
OK the UK is clearly different, but I think it can be explained by the numbers hovering above 4k for a while, and the slow ascent to / descent from 4k+. The shape above 4 looks good again. The Italy graph might show a similar effect.
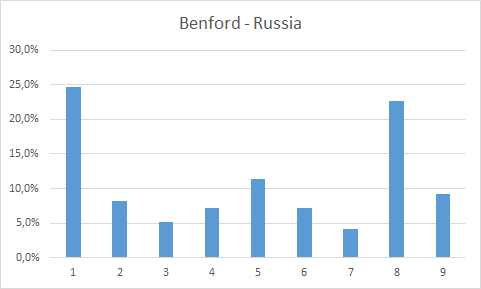
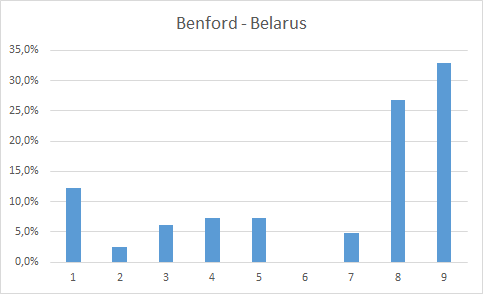
Now some clear outliers IMO:
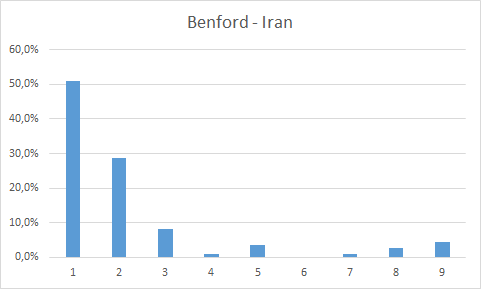
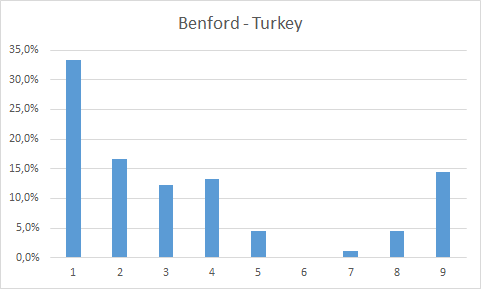
Russia has at least a large 1, but Belarus is totally ridiculous, it’s like Benford reversed! :D I say they’re juking the stats! :mad: I think what we see here is numbers of 10k+ (Russia) or 1k+ (Belarus) getting changed to 8k+ in Russia, and to 800+ in Belarus. The Turkey graph might show this a bit as well.
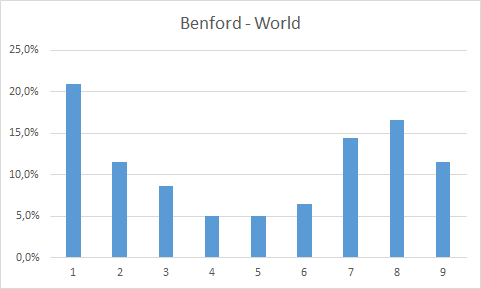
Anyway, to conclude, let’s have a look at the worldwide daily new cases:
:eek:
I think there is more stat-juking going on in the world… :([/QUOTE]
From 22 - cool post.
3 Likes
Everyone listen. Don’t you realize that a mask completely blocks all oxygen from entering your face and shoves all that CO2 right back down your throat? I believe the doctors got the idea from the Saw films.
3 Likes
All the anti-vaxxers on my Costa Rican ex-pat FB group are freaking out about this. For whatever reason tons of ex-pats seem to be anti-vaxx.
Apologies if ponied, but here’s a study from Germany on face masks and their effectiveness on spread. They exploit that places there, (in particular Jena,) made them compulsory in advance of the rest of the country, so they use methods to then compare face masks with no face masks. It seems decent news:
Depending on the region we analyse, we find that face masks reduced the cumulative number of registered Covid-19 cases between 2.3% and 13% over a period of 10 days after they became compulsory. Assessing the credibility of the various estimates, we conclude that face masks reduce the daily growth rate of reported infections by around 40%.
3 Likes
Wasn’t expecting another parks and rec episode so soon
1 Like
Florida with a new record high 1900 cases a day after their previous record high 1690. Once there’s a villages outbreak Trump is in trouble