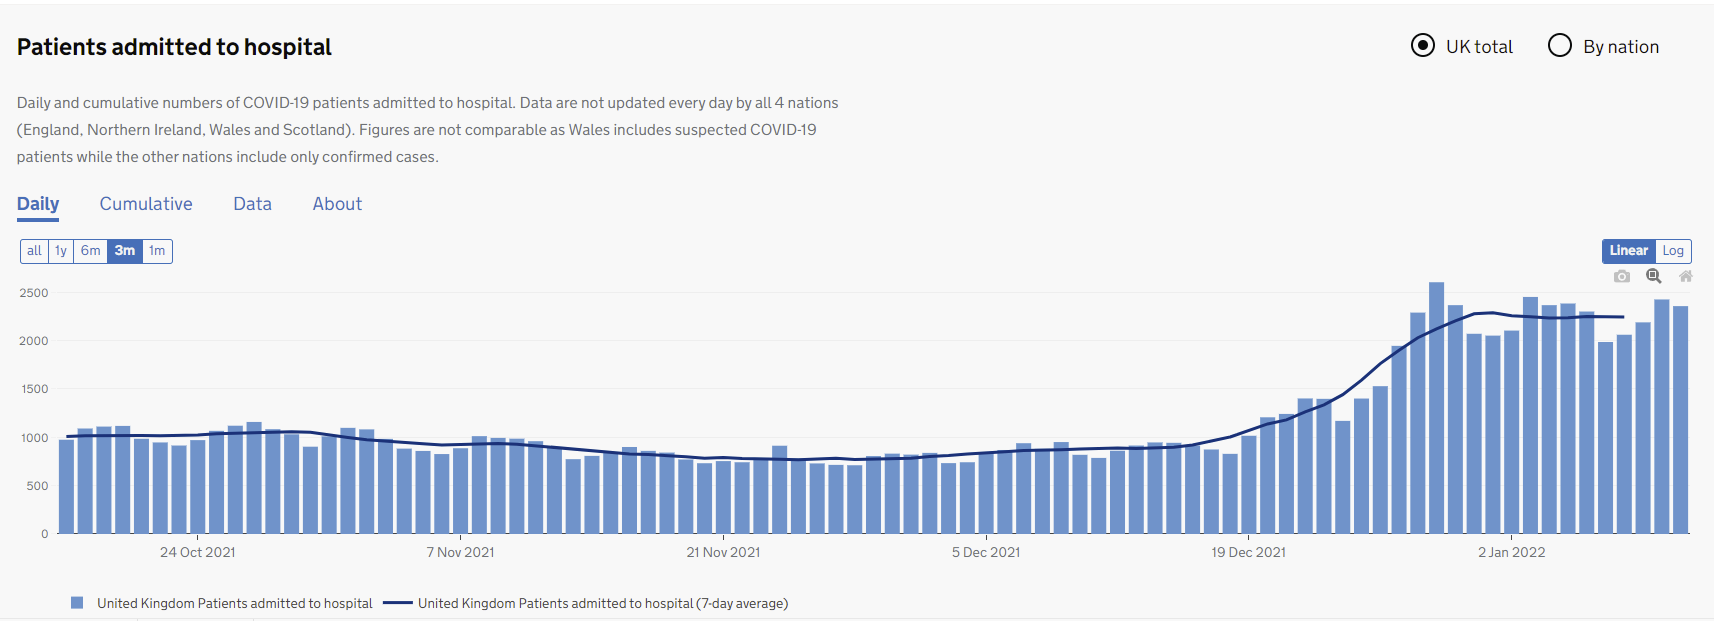
Weird because they clearly have variations in a seven day pattern in their data
https://coronavirus.data.gov.uk/details/healthcare
(computers aren’t being turned off, people come in less on weekends)
Weird because they clearly have variations in a seven day pattern in their data
https://coronavirus.data.gov.uk/details/healthcare
(computers aren’t being turned off, people come in less on weekends)
I don’t think your chart says what you think it says. I could be mistaken but it sure looks like Fri-Sun is lower than Mon-Thurs most weeks.
It’s neat how the admittances show a clear periodic trend but the patients on vents graph is smooth. People aren’t waiting until Monday to get vented, it seems.
No I would just keep her company and binge tv shows in bed together. There’s no way she had any desire to do that sort of thing with how she was feeling.
Need to look further back than the month chart, seeing as though xmas and new year both weekends
Has anyone seen any data on the 95% confidence interval of the incubation period of Omicron? My girlfriend is leaving her live-in job next week and moving in with me, and she plans to isolate in a spare bedroom for long enough to reduce the risk substantially, because the family she’s living with is actively trying to catch it.
I’m guessing the answer is in the 7-12 day range somewhere, but I haven’t seen that data yet for Omicron. She’ll do a test before she comes out of isolation too.
UK cases down 40% 7DMA (-115k from peak), testing down 21% 7DMA (-2.5m from peak) - gotta be missing a few… but the hospital stats will catch 'em
You were missing a few at the peak, too, though (all countries are). Testing being down 21% is a pretty good indicator that fewer people are getting sick. I wouldn’t be surprised if the ascertainment bias is actually lower now than at the peak, even with the decrease in testing. So that should be a good sign.
The hospitalization stats are going to look quite a bit different, because of the lag from infection to hospitalization (likely 2-4 weeks) and the lag from hospitalization to death or discharge (likely another 2-4 weeks I’d guess). So the hospitalization curve should lag the case curve by 2-4 weeks on the way up and 4-8 weeks on the way down. The slope will probably be much less steep on the way down.
Is your theory that this is going to be different in the UK based on a thesis that:
A) The UK staffs differently for public health positions and has people compiling this data 7 days a week.
B) Hospitals in the UK are better staffed on the weekends than they are in the US.
C) People are more likely to go to the hospital on the weekend in the UK than they are in the US.
I could definitely buy C, just because the UK has a more functional healthcare system. People in the US sometimes try to wait for Monday to go to the regular doctor’s instead of the emergency room so that they don’t get hit with a huge co-pay. I assume this is not the case in the rest of the developed world. I could maybe buy B, but I’d be surprised if it extended to the people handling the data (as opposed to actual medical staff). A would shock me.
My guess would be that the US has both a reporting lag AND an actual patient lag, whereas the UK may just have a reporting lag, so both would dip on the weekends but the UK would be a less pronounced dip - which is what your chart showed I think.
At this point, Nate’s periodic review of Google searches is probably as good if not better than the case data.
Eric feigel den (?) is out with some graph showing excess deaths in SA spiking but at a bigger delay va other waves. His a bit chicken little and I can’t dig as the boarding door is closing.
Masks are 80% higher quality (N or KN95) at ATL.
Why are you only interested in the 95% confidence interval if you fear serious consequences from infetion?
You wouldn’t get in a plane if you knew it had a 5% chance of crashing.
It wouldn’t be a 5% chance of crashing in this metaphor would it?
She’s not guaranteed to have an exposure or a case, first of all. The family could continue to run good and not catch it (or run bad in their eyes since they want it). She’s also wearing an N95 when she’s outside of her room this week.
So the 95% risk reduction doesn’t mean a 5% chance she has covid. It means assuming 5% of the risk she does, which is even lower. Plus she’s going to test, which further reduces the risk. I’ve got to imagine a 95% confidence interval on incubation period on top of a rapid antigen test eliminates around 98-99% of the overall risk, which was something in the neighborhood of 5-10% multiplied by the chances that one of the five of them is positive this week.
So if we use a 95% confidence interval on incubation, the risk she has it should be way way under 1%.
Testing being down 21% is a pretty good indcation our government has stated you no longer need to PCR if you’re positive on LFT (11/01/22)
Perhaps, but I guess the best way to put it is this: we would expect the testing rates to drop when the case curve started to drop. So this is not an unexpected decrease. The curve dropping seems to match numerous other countries and in the case of the US, states.
So like the testing data is doing what we would expect it to do, regardless of a government change in policy regarding testing. Also given that some % of those LFTs are getting reported anyway, the difference that they would make in case count is probably far less than the sum of positives on LFTs.
Wat?
Thanks, appreciate it! I suppose peak viral load is a decent proxy for what I’m looking for. What I really need to find is where on the front side of that viral load curve is it becoming detectable by a test and/or are symptoms starting. This tells me what to do after that happens, which hopefully won’t be a situation we’ll be in.
I went to the study itself and it starts at day 0 being symptoms or a positive test, so they don’t have the exact data I am looking for.
The OG strain had a 99% confidence interval of 14 days for the incubation period, it seems like the consensus is Omicron is significantly faster. Looks like the average incubation period is 3 days versus 4 for Delta an 5 for the OG strain. So that could mean 2 days shorter (12), it could mean 60% as long (8-9 days), or it could mean ~nothing because we’re trying to draw conclusions and make educated guesses and we could just make assumptions that don’t hold.
Here’s a tweet about that super spreading Christmas party in Norway… Looks like all the cases were testing positive within 8 days of exposure. The sample is 65 confirmed cases and 15 probable.
https://twitter.com/tylerblack32/status/1476380628320878594/photo/1
And here’s the actual study. Looks like they kept testing/observing symptoms through 12/13, and nothing popped after 12/4.
What do you guys think? That makes 10 days seem extremely likely to catch > 95% of cases. 8-9 days is probably enough?
Shout to Norway and the European CDC for actually doing a study on this unlike USA#1.
This is pretty much my stance too, but I’d expect 99% of people here to agree with it. I think it’s been pretty clear throughout the pandemic when the American CDC is lying or half-assing, because it’s always been done for one of two reasons as far as I remember:
For the greater good (ie protecting mask supply for healthcare workers).
For economic gain.
Essentially, if you want to continue trying to reduce your risk of pozzing as much as possible, you’ve got to go beyond CDC recommendations.
I think one thing that is being overlooked societally and perhaps here as well is the risk of Long COVID, but mostly western society has just had enough of the precautions and would rather deal with a hypothetical future problem than wear a mask one more minute.
GermanHousehold with 250k cases per million on a test positivity rate of25% today.
My son (8) tested positive on his at-home-test today. As both my wife and I are teachers, the whole family does them every school day. We confirmed his result with a test from a different brand and then we went and let the Red Cross do a PCR-test afterwards and are now waiting for the results. His temperature was slightly raised on Saturday (101°F), but he tested negative then.
Interesting to see the different reactions from our different schools today. But we all stayed home. Wife and I are boosted, my daughter (12) is double vaxxed. My wife and daughter were in contact with two people with health risks over the weekend, but they are both boosted themselves, so we don`t worry too much.
Let`s see what kind of household spread we will experience.
edit: forgot to add: my son is single-vaxxed. Was supposed to get his second dose on Wednesday.