Crypto?

Crypto?
But it doesn’t seem to me that this is assessing the question at hand. The question is whether or not N stocks that have an expectation of beating the market are diversified enough to realize that expectation over X years.
So like if the expected alpha is 25% per year, I can underperform the median of the group, underperform the expectation, and still beat the S&P.
I think in this context, the idea with the diversification is not to have a black swan event or fluke event do so much damage to your portfolio that it’s insurmountable. Like UMC is in Taiwan, so there are geopolitical risks there. If I had five stocks of Taiwanese companies in a portfolio of 15, I could get crushed by China going to war with Taiwan. Or if I had five companies with tons of exposure to Southern California and the big one hit… Or if I had five steel companies and the price of steel cratered.
To calibrate your expectations, shortly after she became CEO, GM had to recall 30 million cars after 124 people died due to a manufacturing defect that let the key come out of the ignition while driving, rendering the car unsteerable and disabling the air bags. GM was apparently aware of the defect for as long as a decade before issuing the recall. Barra did have to testify in Congress for that one, but obviously kept her job.
You’re not wrong, but I think the numbers don’t play out that way. Individual retail investors trying to pick stocks don’t end up with anything like a 15% chance of a great outcome like retiring at 50. The numbers probably look more like:
Boring strategy - 0% retire at 50, 95% retire by 63
Big brain stock picking - 0% retire at 50, 1% retire by 60, 4% retire by 63, 95% underperform the boring strategy, 100% blame SOCIALISTS for ruining your great investment ideas
It’s really hard to overstate how bad active investing does over the long run.
What’s the difference between a Vanguard Target Retirement Fund and a Vanguard Institutional Target Retirement Fund of the same year?
They have different stock tickers and different prices.
You probably can’t buy the institutional fund as an individual investor, but you might be able to through your employer’s plan. The institutional fund should have lower costs.
Yeah, I mean if your response to ‘1 in 25 stocks account for 100% of the net return in the stock market over the past 100 years’ is, “I’m going to successfully pick those stocks” and/or “I’m going to successfully time entry/exit of the other 24”, then you should be good to go.
Another way to think about this is that missing out on the “next big thing” is another kind of risk. If your long-term returns are dominated by getting in early on the next Apple (not familiar with the data, so taking it on faith for now), then failing to buy Apple is ~as bad as loading up on Taiwan before the invasion fleet arrives.
If you think of it that way, then any investment thesis involves loading up on risk of missing the NBT. You’re specifically aiming at where you think the NBT is going to be, which means that if you’re wrong, you’re aiming away from where the NBT really is. Now, if you have alpha, your aim will improve your expected investment in the NBT, but it greatly increases the risk too. You don’t just get slightly better returns than the market, you either find the NBT and hit a huge home run, or you miss it and get 3% nominal for the next 5 years.
The “short Cathie Wood” fund is up 78% YTD lololol
This is a sentence that sounds like it means a lot, but it doesn’t necessarily mean a whole lot.
Like, perhaps 1 in 25 stocks loses enough to offset the gains of a bunch of the rest. Maybe picking a sample that avoids that one is just as effective as picking the huge winner.
No not really. I’m not trying to hit 10 baggers or 100 baggers. I’m trying to beat the market. Most of the stocks I’m in, I’d be exiting in the +50% to +100% range, perhaps sooner, unless there’s a fundamental change that drives them up more.
Precise definition can be read here: https://deliverypdf.ssrn.com/delivery.php?ID=663088101094066099126106089098118006019074041037048078090070000097017002119007011122107117023039103016043127073028078019065011031015032054022016126029031032085079074004092005029109101006095009029123015007076101011005008029103081116093124065&EXT=pdf&INDEX=TRUE
And yes, by far the most common modal CAGR (rounding to nearest 5% increments) for any listed stock is that it goes to zero.
I’ll admit that I thought it was a crazy statistic when I first read it, and I kind of still think it’s not terribly meaningful. But there’s a simple description here that doesn’t require you reading the whole paper:
More importantly, there’s an actual Excel file that offers the contribution of each firm’s returns that he uses to support this calculation:
https://wpcarey.asu.edu/sites/default/files/2021-10/wealthcreation19.xlsx
Since I do have access to a very good stock price database, I had planned on doing a quick and dirty look at how annual returns of randomly-selected portfolios of X holdings would compare to the overall index return, but I’ve been busier than expected and haven’t had a chance to actually do it yet.
I think the key takeaway is that people incorrectly assume that a lack of diversification means that they are simply increasing std dev symmetrically around a shared expected mean. Whereas you are actually introducing positive skewness to your return distribution where your median expected return becomes materially worse than the market overall.
For most people this is a very unappealing proposition.
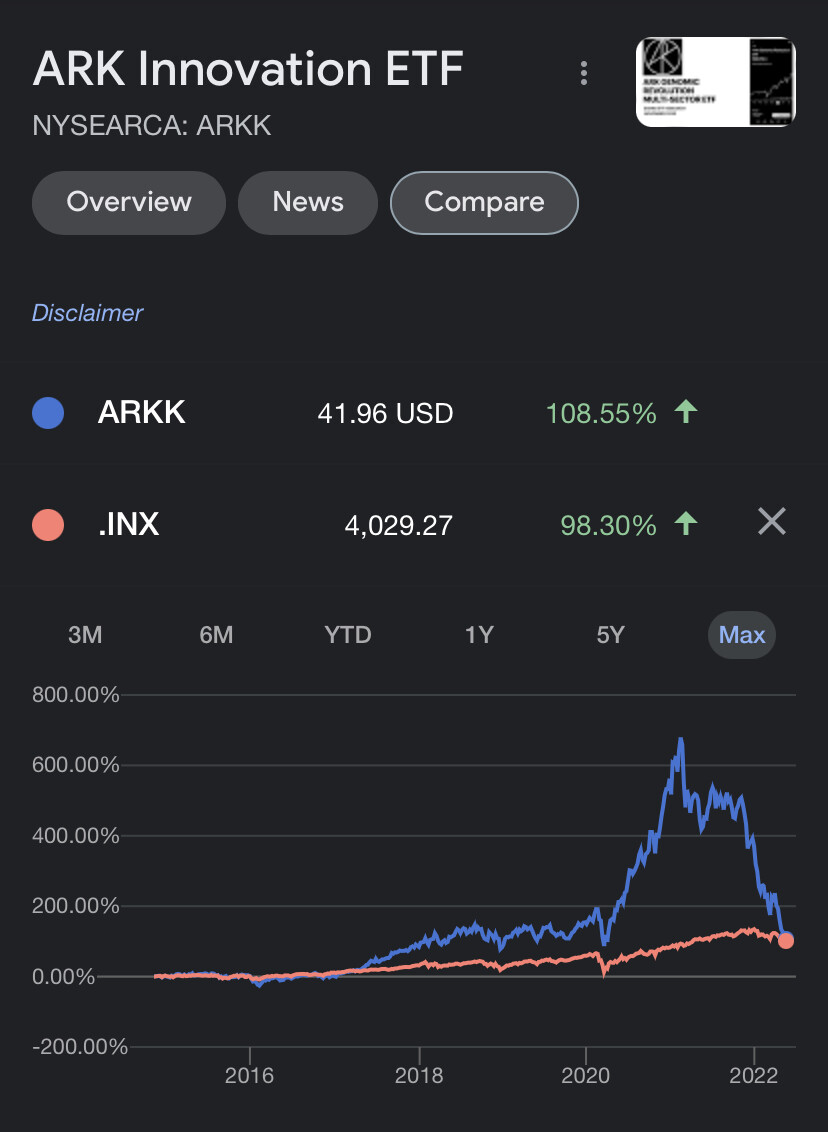
Still barely beating out s&p 500 performance over life of fund. Will be interesting to see when that finally falls.
If you want to take on additional risk just buy the triple q’s. It should be ahead of both over the same time period.
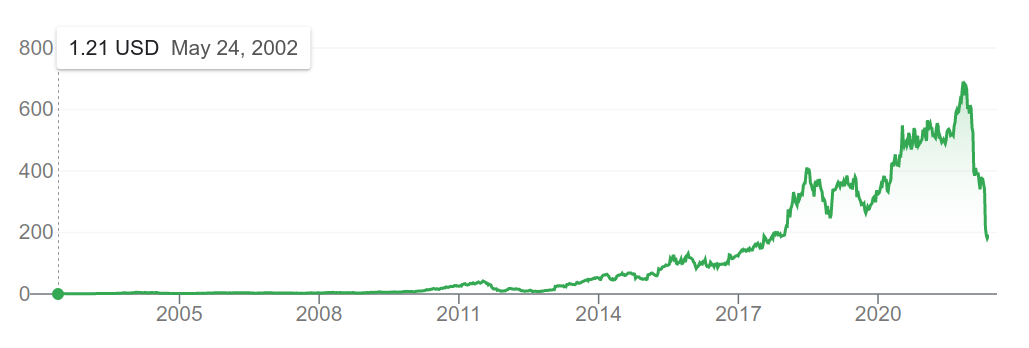
The most surprising thing to me is that it’s a 2018 JFE. No one has looked at this before? But then I realized 26.5% of all wealth creation occurred between Dec 2016 and Dec 2019 according to their metric. Can I get a JLAW OK GIF? Seems like the surprise factor (the magnitude, not the underlying phenomenon) is maybe the result of timing. Analyzing right-censored buy-and-hold strategy where many of the outsized contributors to returns look like this today
seems like it would be sensitive to where you cut the data collection. I mean, the FAANG (and adjacent) line-only-goes-directly-straight-up-forever stonks paired against all-time low interest rates are going to produce that effect up until Dec 2021. I wonder how different it looks if you roll the stop date back and recalculate every year? Specifically pre-2008, before and after dotcom bubble, and other notable inflection points.
It’s not enough for ARKK to just match the index, doesn’t it have to beat the index by a healthy margin to offset whatever fees Cathie Woods & Co. get paid?
Not to mention you’re taking more risk with massively volatile stonks so your returns should be higher
The stock price is presumably factoring in fees, but comparing it to S&P since inception is pretty lol.
In a hypothetical future where Bitcoin is down 93% off its highs I guess it figures we would have people saying “it’s still beating the S&P since 2013”.
I haven’t dug into it too much, but my initial thoughts when reading it were: