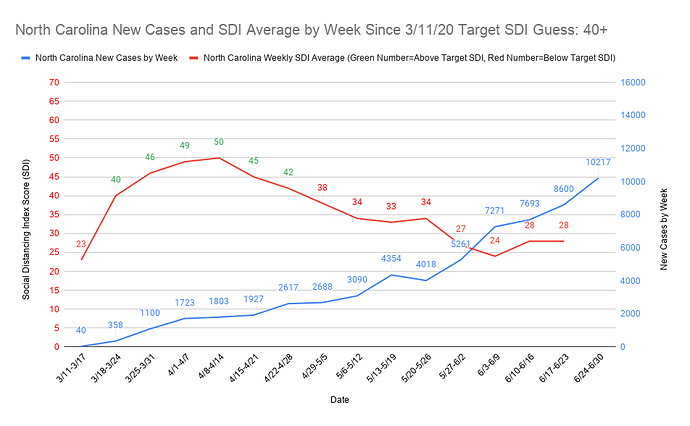
Here’s a little more analysis from last week’s new cases vs. SDI graphs. There are three tiers here. The worst tier has states that fell well below my target SDI guesses for multiple weeks. The second tier has states that fell well below my target SDI guesses but for only a short period of time. The third tier has states I think are on the danger line.
All of these states are ones that should be watched for prolonged surges (does not indicate level of case rise but may be more predictive of the length of surge). Those in the first tier might be in for the longest surges, but may also have the largest case rises during that surge period. I’m holding to my prediction that North Carolina will be one of the longest hotspots for an undetermined amount of time if my target SDI guess is right. I have no idea whether North Carolina will end up in a Florida type situation, but I think its best prospects, if my target SDI is right, are something similar to Arizona for a prolonged period of time. Again, all this is based on guesses of what I perceive to be the target SDI as of last week. I should be able to add more data on Monday or Tuesday if there is an update.
One last note is prolonged good SDI may nullify some of the effects that could happen below, which is part of why I think several places that aren’t performing poorly are worth tracking.
Tier 1:
North Carolina (4 weeks 12+ below target SDI, 1 week 7 below target SDI, 2 weeks 6 below target SDI)
Alaska (1 week 9 below target SDI, 2 weeks 8 below target SDI)
California (2 weeks 9 below target SDI, 2 weeks 5 below target SDI)
Georgia (2 weeks 7 below target SDI, 2 weeks 6 below target SDI)
Ohio (1 week 8 below target SDI, 1 week 7 below target SDI, 1 week 6 below target SDI)
Mississippi (1 week 8 below target SDI, 1 week 7 below target SDI, 1 week 6 below target SDI)
Wisconsin (1 week 9 below target SDI, 2 weeks 7 below target SDI, 1 week 6 below target SDI)
Kentucky (1 week 9 below target SDI, 1 week 8 below target SDI, 1 week 7 below target SDI, 1 week 5 below target SDI)
West Virginia (1 week 9 below target SDI, 1 week 8 below target SDI, 1 week 6 below target SDI, 1 week 5 below target SDI)
Rhode Island (3 weeks 7 below target SDI)
Tier 2:
Texas (1 week 8 below target SDI, 1 week 7 below target SDI, 1 week 6 below target SDI)
Florida (1 week 7 below target SDI, 1 week 6 below target SDI, 1 week 5 below target SDI)
Washington (1 week 8 below target SDI, 2 weeks 6 below target SDI)
Illinois (1 week 7 below target SDI, 2 weeks 6 below target SDI)
Tier 3:
South Carolina (1 week 7 below target SDI, 1 week 5 below target SDI)
Hawaii (1 week 7 below target SDI, 1 week 5 below target SDI)
Nevada (1 week 6 below target SDI, 1 week 5 below target SDI)
Oklahoma (2 weeks 5 below target SDI)
Iowa (if target SDI is 30, they have 3 weeks 9 below target SDI, if target SDI is 25, they don’t belong on this list)
South Dakota (1 week 6 below target SDI, 2 weeks 5 below target SDI)
North Dakota (1 week 6 below target SDI, 1 week 5 below target SDI)
Montana (1 week 6 below target SDI, 1 week 5 below target SDI)
Massachusetts (1 week 5 below target SDI)
Michigan (1 week 5 below target SDI)
