Gah, I’m going to take anything Wired says with a huge grain of salt.
I was going to ask what his blood type is since I’ve been concerned about reports that my type A blood might be a risk factor, but a little googling found this from a few days ago so now I’m less worried:
Writers just bringing all of the storylines together now…
https://twitter.com/ShimonPro/status/1285748478711345154?s=19
I of course pee’d freely in the desert all the time. It was actually fun as you’d have girls walk by, not in a direction they could see me being because I’d be far out obv, but they could see me peeing, and they’d offer words of encouragement. This is the thing I miss most due to the pandemic, Those gatherings are truly a magical place and I think everyone on UP should come with me once. Would be the best vacation you ever had. Should be noted the age ranges are wide and there are plenty of 40-60 year old. including tons of really cute 50 year old ladies.
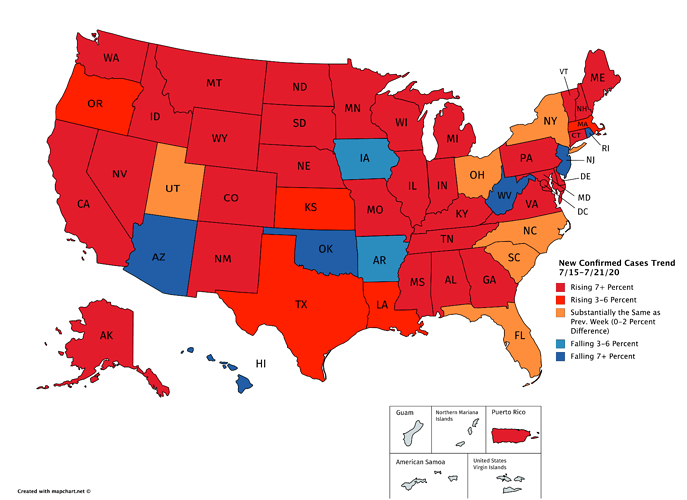
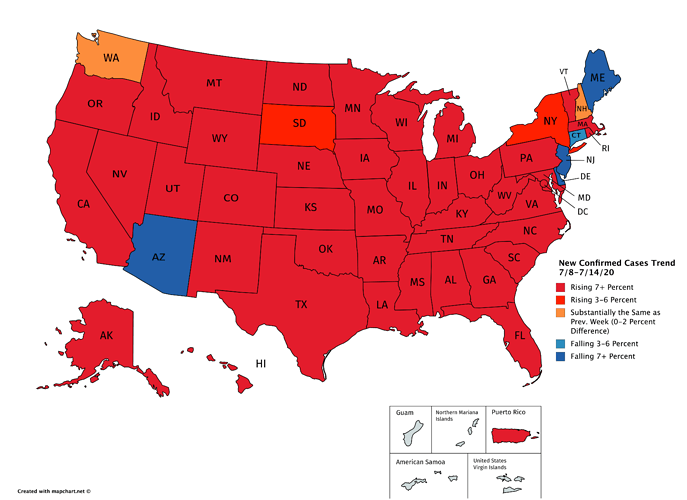
This is kind of like goofy’s numbers in map form, but just as a new case trend against the previous week. I put these together every Tuesday. The first is from 7/15-7/21 and the second is from 7/7-7/14. If you catch any mistake, I’ll revise the map.
Secondarily, I put together a chart like goofy’s that’s meant to set a baseline for case prediction. I don’t think it’s necessarily instructive at this point, but the idea is to adjust the 7DMA of daily new cases to have everyone at the same positivity rate (I’m using 4 percent as that baseline) to create what might be their ‘real’ 7DMA daily case number. Any place below 4 percent positivity doesn’t get adjusted as their new cases are probably relatively accurate.
The secondary thing to this exercise is trying to predict (inside a margin based on positive percentage) what the daily 7DMA might be 14 days out based on the day’s SDI. I don’t have time right now, but what I’ll eventually do is back up in time to see how close these guesses are. I’ll hide the details for the exercise, but it’s meant as more of a placeholder in time for right now. My hypothesis is we can probably now predict relatively closely what each place’s ‘real’ case number max is based on a positivity rate of 4 percent (using an adjustment). This will all probably be thrown in the trash once pool testing starts happening on a large scale. The starting point for this exercise is in the spoiler below.
Numbers
| State | 7/7/20 SDI | Unadjusted Cases/d | Max Daily Adjusted Estimate Based on 7/7/20 SDI and 4% Pos. Pct. |
|---|---|---|---|
| FL | 37 | 11172 | 12848 |
| TX | 35 | 9525 | 10573 |
| CA | 37 | 9180 | 9455 |
| GA | 33 | 3575 | 3968 |
| AZ | 35 | 2940 | 3528 |
| TN | 24 | 2165 | 2273 |
| LA | 35 | 2077 | 2202 |
| NC | 29 | 1911 | 1968 |
| AL | 27 | 1871 | 2133 |
| SC | 33 | 1849 | 2071 |
| OH | 25 | 1317 | 1343 |
| IL | 28 | 1177 | 1177 |
| MS | 26 | 1140 | 1300 |
| NV | 32 | 1129 | 1310 |
| VA | 34 | 989 | 1009 |
| WI | 24 | 926 | 963 |
| PA | 30 | 870 | 887 |
| WA | 33 | 855 | 864 |
| MO | 22 | 848 | 882 |
| MD | 39 | 755 | 763 |
| IN | 22 | 747 | 777 |
| MI | 25 | 742 | 742 |
| NY | 41 | 715 | 715 |
| AR | 22 | 703 | 745 |
| UT | 24 | 647 | 679 |
| MN | 25 | 612 | 612 |
| ID | 21 | 552 | 635 |
| KY | 22 | 548 | 564 |
| OK | 22 | 527 | 543 |
| IA | 21 | 517 | 543 |
| CO | 25 | 474 | 488 |
| KS | 24 | 468 | 501 |
| OR | 30 | 333 | 340 |
| NM | 29 | 274 | 274 |
| MA | 32 | 271 | 271 |
| NE | 21 | 206 | 212 |
| NJ | 37 | 191 | 191 |
| AK | 23 | 135 | 135 |
| WV | 25 | 113 | 113 |
| DE | 30 | 111 | 112 |
| MT | 21 | 108 | 108 |
| ND | 19 | 102 | 104 |
| CT | 32 | 80 | 80 |
| DC | 61 | 68 | 68 |
| SD | 20 | 63 | 64 |
| RI | 27 | 56 | 56 |
| WY | 20 | 41 | 42 |
| NH | 20 | 25 | 25 |
| ME | 20 | 22 | 22 |
| HI | 48 | 21 | 21 |
| VT | 22 | 8 | 8 |
| USA | 28 | 66193 | 68841 |
Hopefully the exercise makes sense.
Not to be a negative nancy but he could just be presymptomatic. I really hope thats not the case though and he just caught a very small viral load.
Sending best of luck to your uncle.
How the fuck are TX/FL trending downward when CA is trending upward? CA closed a bunch of shit a week ago right and TX/FL still fully open for business with little mask usage.
I know there is a lag between closing and cases going down but still, why CA trending upward :(
So fucked up what happened to her. I hope Biden gives her a pardon. This is why I think Pardons can be used for good when there isn’t a ghoul in office because so many people get completely fucked by the system. Like if you made me pres every single non violent drug offender would be out free that first day or however long it takes to process them. I’m sure if we ever get AOC we would get something similar.
CA SDI has been very disappointing for a long time. I think it’s going to take a bit to drop after that.
Ca reporting accurateish and the other two are fudging numbers, someone prove me wrong 
9% positive rate means it’s not accurate.
On public transport in Melbourne. Maybe 80% mask adoption. However seeing as it’s now mandatory (or maybe starting at midnight) that isn’t great.
the Third column is where we are at now?
The fourth column is a prediction for now based on two weeks ago SDI?
If so you’ve cracked the code. A simple XY plot of actual vs predicted is in order. Eyeballing it looks damn impressive.
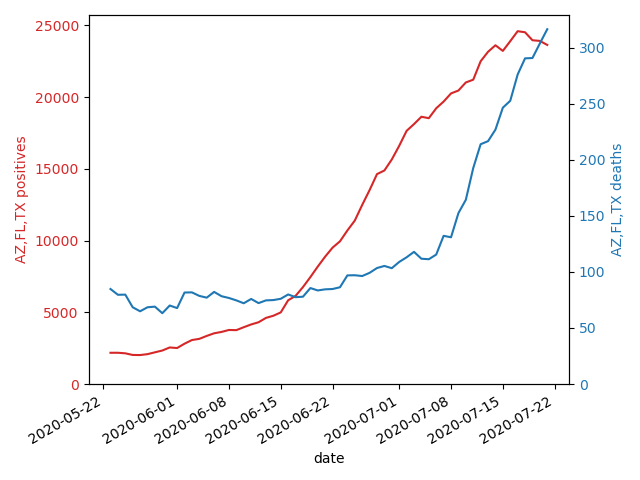
Holy hell. The death rate hasn’t really changed from earlier this year. That slope of the increase for the death rate was what I used back in March/April because the testing was so inadequate. It’s not as severe now but that’s Scary growth.
I’m heading out in my trip Thursday. Maybe I’ll have hotel time to try and compare the death rate slope then in NY/NJ and now AZ/FL/TX.
Nationally 28 day cfr is holding pretty close to 3%.

Goddamn fantastic analysis itt folks.
No predictions yet. That’s just the adjusted number based on positive pct. trying to create a standardized baseline.
I’ll be going backwards to see if this is a way to predict for the future. It might be nothing, but I got the idea from looking at the NC numbers and how they’ve seemed to have flattened at a bad run with a static SDI.
Right now its just a placeholder, sorry for the confusion.
Editing to Add that my not yet prediction is that at the particular SDI stated at a 4 percent positive rate that I think it’s possible the number in the 4th column is the max number of cases you will see 14 days later. Lower SDI than that would produce a higher max, higher SDI a lower max at 4 percent. Hopefully that makes sense. Again, I haven’t looked at any of the data yet and was just setting a baseline to start.
Yikes. R0 in the Czech Republic is 1.2 now. Four days ago, it was 0.9.
Media has resumed sharing updates on case statistics. Over 5,000 active cases which is more than at any point during the first wave.
Prague has an outbreak connected to a night club in Prague 2.
Explains the jump in new cases seen in the 7dma. Probably some 20-something tourist given the club’s location. No wonder every local low-key hates tourists.
Oh I’ve been thinking the same. He’s in his 90’s. Hopefully it’s nothing serious.
Much higher risk for them than you tbh.
No this is worth going over, and is in fact a major focus of the oxford vaccine paper in the lancet.
https://www.thelancet.com/journals/lancet/article/PIIS0140-6736(20)31604-4/fulltext#seccestitle150
Go to results and look at the graph that they have for side effects.
First off, they run the study with patients taking tylenol prophylactically, so they know it’s going to suck. They show that tylenol helps, but the difference in pain and tenderness between the control and the vaccine makes it clear to me that this shot will suck to get. Would obviously get it still, but it’s going to hurt.
I had a real strong response to both shingles shots but totally worth it after watching what my SIL went thru.

