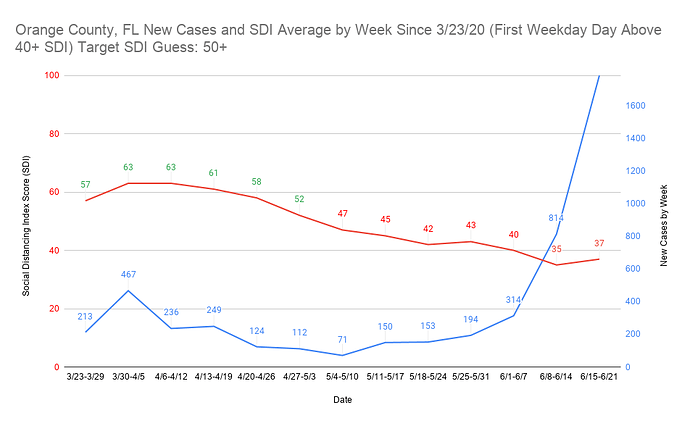
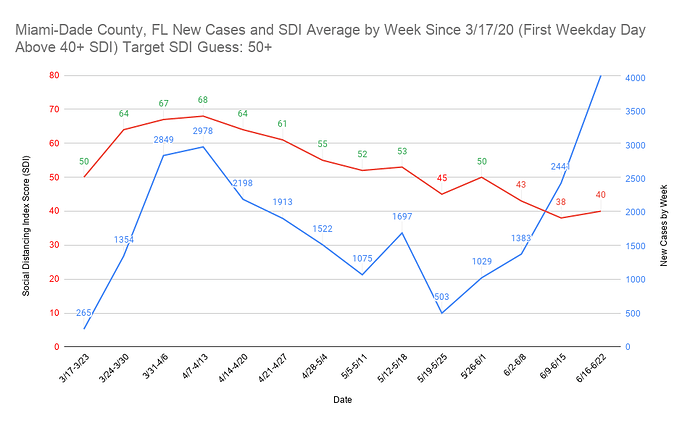
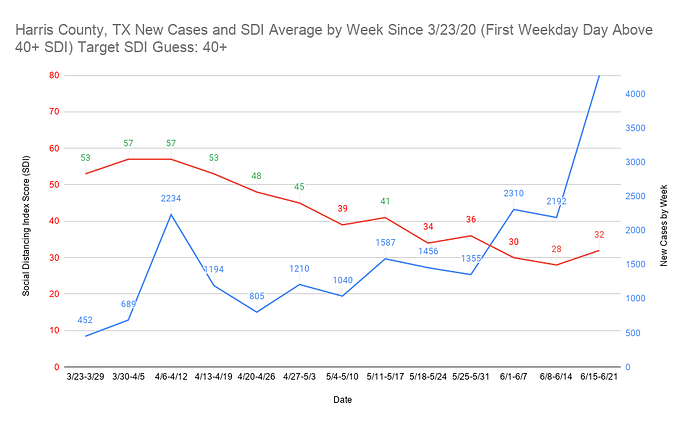
Here are Orange County, FL, Miami-Dade County, FL, and Harris County, TX. They’re only caught up to either 6/21 or 6/22 as partial weeks distort the data.
So this would indicate that Orange County needs an SDI > 42 or so, Miami-Dade > 52 or so, and Harris County > 40 or so?
These graphs appear to the naked eye to be non related or even maybe have a negative relationship. Do you think they are just outliers or what is your theory there?
It’s also possible I am misunderstanding what they represent as well. An SDI that is lower is actually bad? Is that right?
There should be an inverse relationship. A lower SDI is bad. SDI goes down, cases go up.
Edit: more accurately, SDI goes down, R0 goes up. So you could have an R0 of like .8, SDI goes up a little, and it goes to .9… Cases are still down, but not trending downward as quickly.
Got it. Thanks. As you said there may be an inflection point after which things go very bad.
America isn’t a 3rd world country lol, its a Cruise ship just cruising from port to port, the passengers, well some are good people, but some are pirates.
The rest of the world should never have let our young aspiring sailors to embark on this cruise ship.
Whatever the minimum SDI is my projected ‘minimum’ to slow the spread. I think going anything lower than 5 point increments doesn’t work from my day level data. The higher above the SDI minimum, I think the quicker spread slows (though we haven’t been in this predicament before). The more below the SDI minimum, it appears to have a faster spread. More than 10 points below the minimum I think induces the disaster of high/fast spread. As you can see by the county level graphs, SDI as you said is not at all created equal. Caveat is again these are all guesses based on watching these trends for months.
You’re probably misunderstanding the graphs. The lower the SDI, the worse it is depending on area. Montana can get away with a 20 SDI or lower with only moderate spread. A 20 SDI in New York would be an absolute disaster right now.
The target SDI is the minimum SDI needed to slow spread (in my opinion). The correlation is that in nearly all cases I’ve put in graphs so far (the easy ones), spread starts clearly rising 14 days after after the SDI falls below the target. I haven’t analyzed how long it takes for spread to slow yet, but it’s obviously much longer to slow it than to rise it.
I definitely was. Appreciate the clarification.
FLORIDA
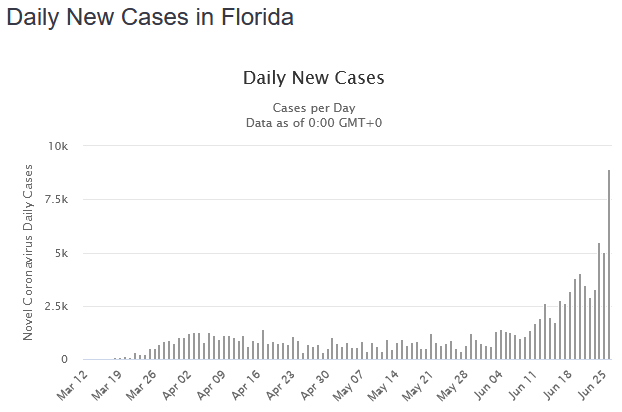
Wookie had it right with Motherofgod.jpg
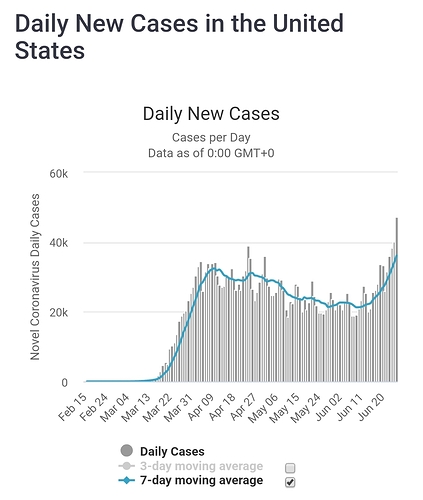
They wont have the testing capacity to measure itbut they will have what 100k/cases a day within two weeks at this rate?
Sadly I think we break that 60k line next week sometime or at least come close. And that will make March and April look like the good old days of the pandemic here.
I’ve literally ate squirrels. They taste damn good.
Who knows. At some point it has to slow down if only because it’s running out of new Floridians to infect. FL is going for herd immunity as quickly as possible.
Almost without fail, the only maskless patrons of Charleston grocery stores are white males 60+, mostly obese. It’s incomprehensible.
Florida has 21m people. Even with a generous interpretation of herd immunity that is 10m infected. At best Florida is 10-20% of the way there probably so the sky is the limit.
I think it needs a mask score and indoor score as well (don’t know the fine SDI details).
Florida is trying to do the world a solid and find out if herd immunity is real and how long it lasts if so.
Sweden called. It’s it takes a fuck lot of time and lot of DEAD PEOPLE
So the SDI limit corresponds to density, specifically weighted density?
