https://x.com/PpollingNumbers/status/1823058810430194073
This is pretty solid. Cook Political Report has this district in “Likely R” with Florida and Texas.
https://x.com/PpollingNumbers/status/1823058810430194073
This is pretty solid. Cook Political Report has this district in “Likely R” with Florida and Texas.
What is this comparing to? June?
I don’t know, honestly. I was hoping someone else would understand context. Tough to imagine the Dems are actually losing the enthusiasm gap right now, though July overall numbers would include the first 20 days of the month when Biden was still the candidate.
I was in the middle of something important and was happy to see a great opportunity to procrastinate. If you look at the referenced twitter user here:
https://x.com/MichaelPruser/status/1823049627769168017
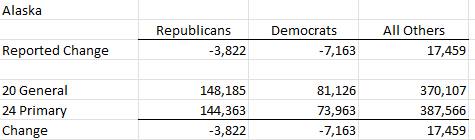
You can see more detail. And if you follow through to his google drive docs, you can see how it’s calculated: Registered voters as of 2024 Primaries relative to registered voters as of 2020 General Election. So Alaska looks like this:
So the net result we’re seeing is driven by some combination of:
I don’t think it’s a comparison to anything. I think (+2) is simply the difference between them in this poll.
So it’s not Rs having a massively better ground game in battleground states right now?
Matt was replying to a different post – the one with the July registration numbers. And yes, it’s comparing to June according to that Michael Pruser guy.
Well that paints a pretty gloomy picture. Made me yikes
Also, I don’t think a July 30 registered voter number speaks to current levels of enthusiasm - Biden didn’t withdraw until 7/21, and it was another two weeks before Harris was officially nominated.
I don’t know what to make of it. Seems like it’s been a long term trend, and it’s across many states so not just a voter roll shenanigan thing. Maybe more consolidated polarization on the R side? Or maybe something funny with the data itself?
No way. I think it’s widely reported that Trump’s ground game is close to nonexistent right now.
I looked at Alaska’s 2022 General data, and the number of registered for all 3 groups falls almost exactly in between the 2020 General and 2024 Primary numbers. Maybe the other states’ data looks different (I’m not manually looking at them all), but I think this is largely capturing broad, long-term trends. If those trends weren’t a problem in 2022 and are not evident in the polls now (which I don’t think they were or are), I’m not worried about that chart and don’t think you should be either.


Where is the dem/rep split? I’m only seeing County in the rows and out to K in columns. On the primary tabs.
I’m sick of polls. Only vibes from now on.
Cautious about taking much away from those polls from an ungraded pollster (honestly, flip the results they’re showing and I’d be even more dismissive of it), but hopefully they’re good polls.
FWIW they had Harris +1 in a 7/23-7/25 poll, so positive movement since then.
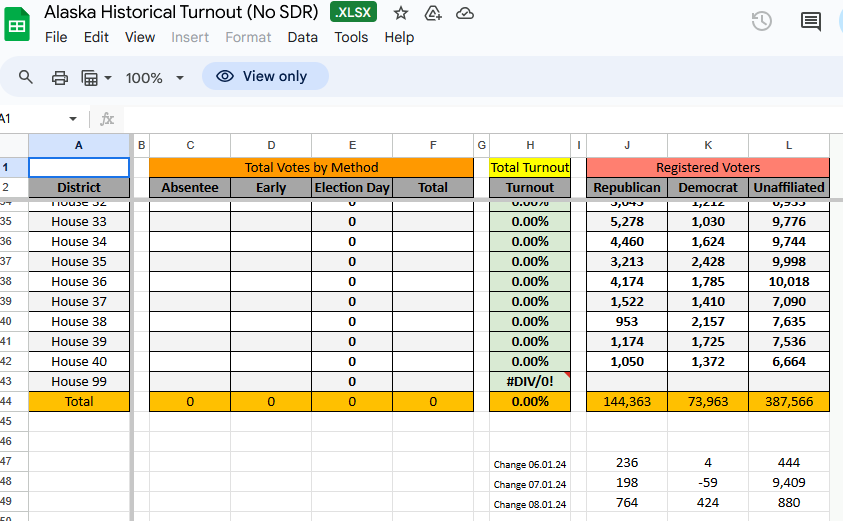
Which sheet/tab are you looking at? If I open the Alaska sheet, it shoes the 2024 General tab, which is empty because it hasn’t happened yet. The '24 Primary tab shows Democrat/Republican/Unaffiliated in columns J/K/L. (Interestingly, that’s LKJ backwards, which goes to show who’s running this). The general tabs have the splits in columns AT/AU/AV.
Maybe I’m not understanding what you’re asking. This is what I see in the '24 Primary tab: