If you’re actually interested here’s some reading.
The researchers had to develop sophisticated new tools that accounted for the gas movement around Sgr A*. While M87* was an easier, steadier target, with nearly all images looking the same, that was not the case for Sgr A*. The image of the Sgr A* black hole is an average of the different images the team extracted, finally revealing the giant lurking at the centre of our galaxy for the first time.
The effort was made possible through the ingenuity of more than 300 researchers from 80 institutes around the world that together make up the EHT Collaboration. In addition to developing complex tools to overcome the challenges of imaging Sgr A*, the team worked rigorously for five years, using supercomputers to combine and analyse their data, all while compiling an unprecedented library of simulated black holes to compare with the observations.
Though scientists had theorized they could image black holes by capturing their silhouettes against their glowing surroundings, the ability to image an object so distant still eluded them. A team formed to take on the challenge, creating a network of telescopes known as the Event Horizon Telescope, or the EHT. They set out to capture an image of a black hole by improving upon a technique that allows for the imaging of far-away objects, known as Very Long Baseline Interferometry, or VLBI.
Each telescope used for the EHT had to be highly synchronized with the others to within a fraction of a millimeter using an atomic clock locked onto a GPS time standard. This degree of precision makes the EHT capable of resolving objects about 4,000 times better than the Hubble Space Telescope. As each telescope acquired data from the target black hole, the digitized data and time stamp were recorded on computer disk media. Gathering data for four days around the world gave the team a substantial amount of data to process. The recorded media were then physically transported to a central location because the amount of data, around 5 petabytes, exceeds what the current internet speeds can handle. At this central location, data from all eight sites were synchronized using the time stamps and combined to create a composite set of images, revealing the never-before-seen silhouette of M87*’s event horizon. The team is also working on generating an image of Sagittarius A* from additional observations made by the EHT.
https://spectrum.ieee.org/the-inside-story-of-the-first-picture-of-a-black-hole
The 1.3-mm wavelength, considerably shorter than the norm in VLBI, also pushed the limits of our technology. The receivers we used converted the 230-GHz signals down to a more manageable frequency of around 2 GHz. But to get as much information as we could about M87*, we recorded both right- and left-hand circular polarizations at two frequencies centered around 230 GHz. As a result, our instrumentation had to sample and store four separate data streams pouring in at the prodigious rate of 32 gigabits per second at each of the participating telescopes.
Interferometry works only if you can precisely align the peaks in the signal recorded at each pair of telescopes, so the short wavelength also required us to install hydrogen-maser atomic clocks at each site that could sample the signal with subpicosecond accuracy. We used GPS signals to time-stamp the observations.
On four nights in April 2017, everything had to come together. Seven giant telescopes (some of them multidish arrays) pointed at the same minuscule point in the sky. Seven maser clocks locked into sync. A half ton of helium-filled, 6- to 8-terabyte hard drives started spinning. I along with a few dozen other bleary-eyed scientists sat at our screens in mountaintop observatories hoping that clouds would not roll in. Because of the way interferometry works, we would immediately lose 40 percent of our data if cloud cover or technical issues forced even one of the telescopes to drop out.
But the heavens smiled on us. By the end of the week, we were preparing 5 petabytes of raw data for shipment to MIT Haystack Observatory and the Max Planck Institute for Radio Astronomy, in Germany. There, researchers, using specially designed supercomputers to correlate the signals, aligned data segments in time. Then, to counter the phase-distorting influence of turbulent atmosphere above each telescope, we used purpose-built adaptive algorithms to perform even finer alignment, matching signals to within a trillionth of a second.
Now we faced another giant challenge: distilling all those quadrillions of bytes of data down to kilobytes of actual information that would go into an image we could show the world.
Nowhere in those petabytes of data were numbers we could simply plot as a picture. The “lens" of our telescope was a tremendous amount of software, which drew heavily on open-source packages and now is available online so that anyone can replicate or improve on our results.
Radio interferometry is relatively straightforward when you have many telescopes close together, aimed at a bright source, and observing at long wavelengths. The rotation of Earth during the night causes the baselines connecting pairs of the telescopes to sweep through a range of angles and effective lengths, filling in the space of possible measurements. After the data is collected, you line up the signals, extract a two-dimensional spatial-frequency pattern from the variations in amplitude and phase among them, and then do an inverse Fourier transform to convert the 2D frequency pattern into a 2D picture.
VLBI is a lot harder, especially when observing with just a handful of dishes at a short wavelength, as we were for M87*. Perfect calibration of the system was impossible, though we used an eighth telescope at the South Pole to help with that. Most problematic were differences in weather, altitude, and humidity at each telescope. The atmospheric noise scrambles the phase of the incoming signals.
The problem we faced in observing with just seven telescopes and scrambled phases is a bit like trying to make out the tune of a duet played on a piano on which most of the keys are broken and the two players start out of sync with each other. That’s hard—but not impossible. If you know what songs typically sound like, you can often still work out the tune.
It also helps that the noise scrambles the signal in an organized way that allows us to exploit a terrific trick called closure quantities. By multiplying correlated data from each pair in a trio of telescopes in the right order, we are able to cancel out a big chunk of the noise, though at the cost of adding some complexity to the problem.
The longest and shortest baselines in our telescope network set the limits of our resolution and field of view, and they were limited indeed. In effect, we could reconstruct a picture 160 microarcseconds wide (equivalent to 44 billionths of a degree on the sky) with roughly 20 microarcseconds of resolution. Literally an infinite number of images could fit such a data pattern. Somehow we would have to pick—and decide how confident to be in our choice.
To avoid fooling ourselves, we created lots of images from the M87* data, in lots of different ways, and developed a rigorous process—well beyond what is typically done in radio astronomy—to determine whether our reconstructions were reliable. Every step of this process, from initial correlation to final interpretation, was tested in multiple ways, including by using multiple software pipelines.
Before we ever started collecting data, we created a computer simulation of our telescope network and all the various sources of error that would affect it. Then we fed into this simulation a variety of synthetic images—some derived from astrophysical models of black holes and others we had completely made up, including one loosely based on Frosty the Snowman.
Next, we asked various groups to reconstruct images from the synthetic observations generated by the simulation. So we turned images into observations and then let others turn those back into images. The groups all produced pictures that were fuzzy and a bit off, but in the ballpark. The similarities and differences among those pictures taught us which aspects of the image were reliable and which spurious.
In June 2018, researchers on the imaging team split into four squads to work in complete isolation on the real data we had collected in 2017. For seven weeks, each squad worked incommunicado to make the best picture it could of M87*.
Two squads primarily used an updated version of an iterative procedure, known as the CLEAN algorithm, which was developed in the 1970s and has since been the standard tool for VLBI. Radio astronomers trust it, but in cases like ours, where the data is very sparse, the image-generation process often requires a lot of manual intervention.
Drawing on my experience with image reconstruction in other fields, my collaborators and I developed a different approach for the other two squads. It is a kind of forward modeling that starts with an image—say, a fuzzy blob—and uses the observational data to modify this starting guess until it finds an image that looks like an astronomical picture and has a high probability of producing the measurements we observed.
I’d seen this technique work well in other contexts, and we had tested it countless times with synthetic EHT data. Still, I was stunned when I fed the M87* data into our software and, within minutes, an image appeared: a fuzzy, asymmetrical ring, brighter on the bottom. I couldn’t help worrying, though, that the other groups might come up with something quite different.
On 24 July 2018, a group of about 40 EHT members reconvened in a conference room in Cambridge, Mass. We each put up our best images—and everyone immediately started clapping and laughing. All four were rings of about the same diameter, asymmetrical, and brighter on the bottom.
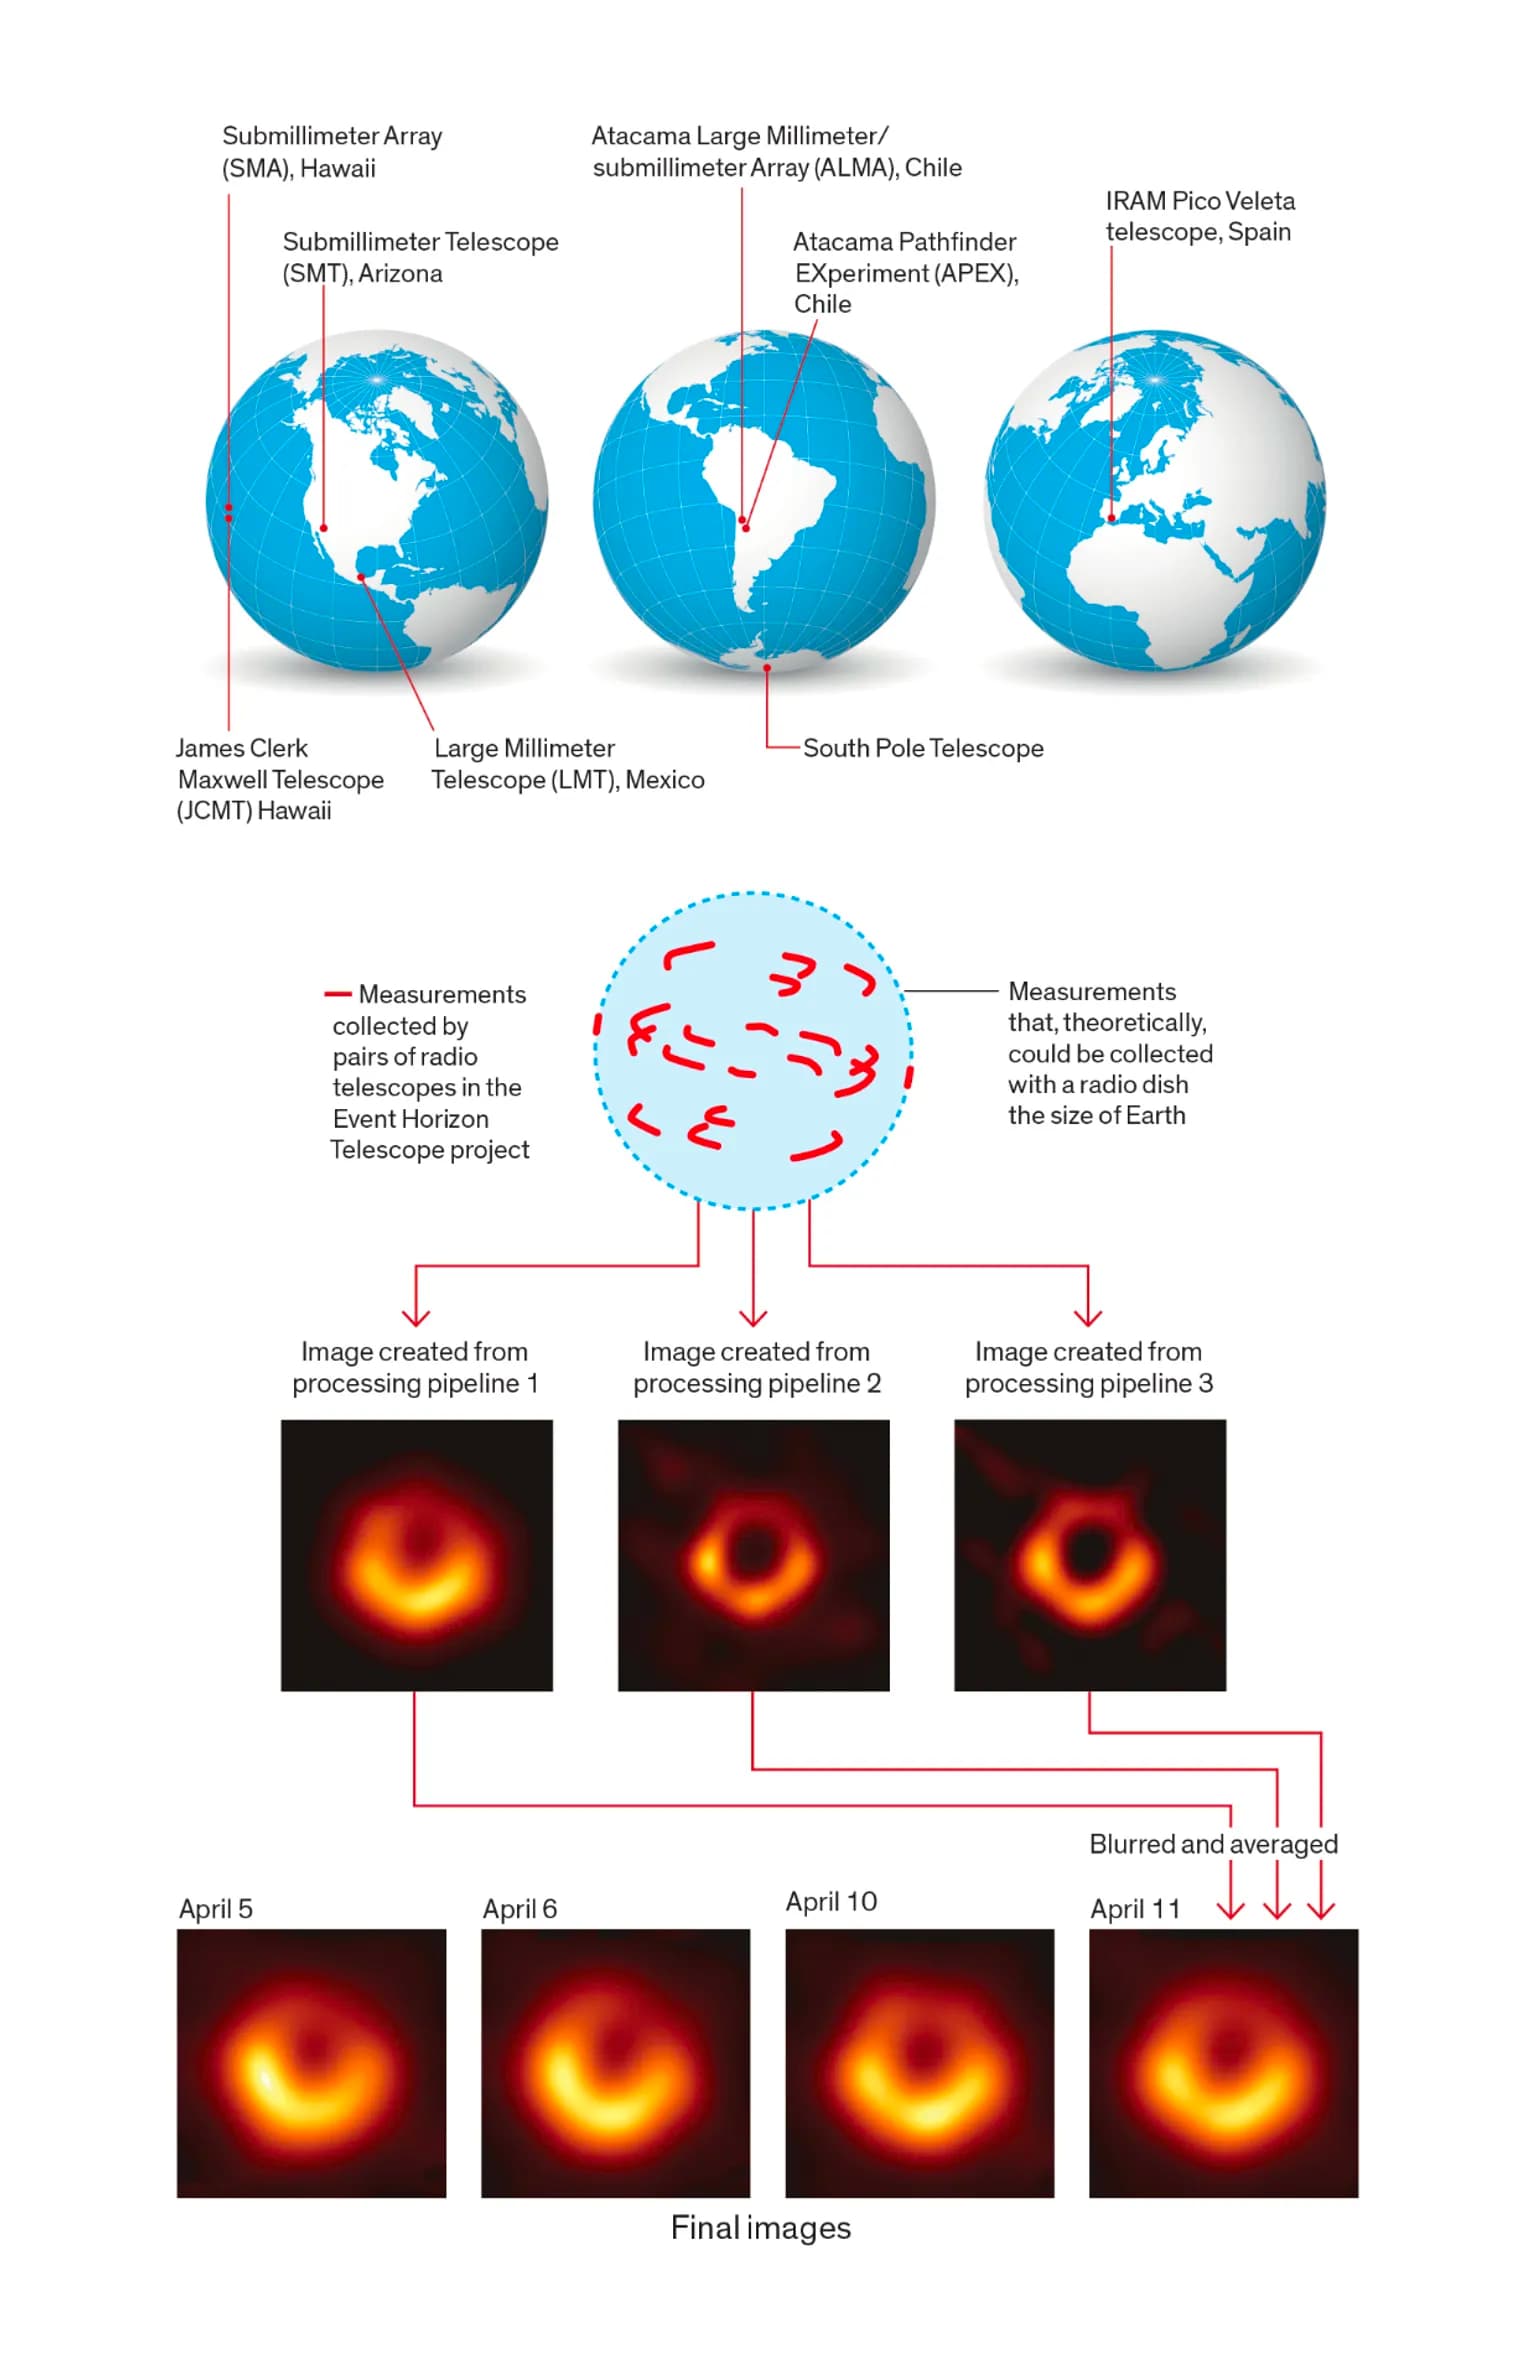
We knew then that we were going to succeed, but we still had to demonstrate that we hadn’t all just injected a human bias favoring a ring into our software. So we ran the data through three separate imaging pipelines and performed image reconstruction with a wide range of prototype images of the kind that we worried might fool us. In one of the imaging pipelines, we ran hundreds of thousands of simulations to systematically select roughly 1,500 of the best settings.
At the end, we took a high-scoring image from each of the three pipelines, blurred them to the same resolution, and took the average. The resulting picture made the front page of newspapers around the world.