Phillies at risk of losing their spot to Milwaukee?
Very much so. 3 runs in 3 games. Of which I watched prolly half the at bats. Just pathetic.
1 Like
At risk? Yes. Will they? No.
1 Like
This,
The Giants are gonna go 7-0 and both PHI and MIL are going to go 0-7
MIL gagged one late that essentially keeps the Phillies 2 up in the loss column (they are 1 up and hold the tie-break).
Ford Proctor homered (374 ft.) to deep left center, Thairo Estrada, Jason Vosler and Austin Wynns scored
Roundup of what I’ve been squawking about. The new seeding is fucked up, the extra wildcards produce less getting in the playoff drama, and getting rid of game #163s is a shame.
I think the extra wildcards producing less drama this year is just random luck. You’re just as likely to have a tight race between the 3/4 teams for the wildcard as the 2/3.
Yeah, this is true. Of course, it’s drama regarding teams who shouldn’t be going anywhere anyways. When they go to 14 playoff teams in 2025, it’ll often be the drama of teams with losing records maybe getting in the playoffs.
Ohtani clean through 7. Only 87 pitches.
1 Like
haven’t been following super closely, is there a consensus on which one of these total badasses should MVP this year?
1 Like
Judge. He’s huge betting favorite.
Ewww, groundball that a fielder puts a glove on is a tough way to go out.
well I guess that shortstop was glad to see that second hit
and yep agree that it’s basically impossible to imagine a world where a new york yankee wins triple crown and passes maris and doesn’t MVP, that would feel nuts, but I’m just being lazy and haven’t actually looked up comparative WAR stuff or read any big-brained arguments about it. Ohtani’s existence seems preposterous
Ohtani has 161 IP and one more scheduled start, so assuming that happens he’ll be the first player to qualify as a hitter and pitcher in the World Series era.
1 Like
Judge is up by a decent bit on WAR, so unless you give Ohtani extra credit for taking only one roster spot Judge is the deserving MVP (and that’s with Ohtani having a better year than last - hitting a bit worse, but pitching much better).
2 Likes
I feel like it is completely against the spirit of WAR to not give Ohtani credit for taking only one roster spot. But that voters have barely begun to accept the WAR numbers listed on websites as relevant and will take another generation to begin grasping it as a malleable concept.
He’s just like me!
2 Likes
Warning: TL;DR Technical WAR Discussion Part I
I’ve seen the roster spot math and think it comes out to less than 0.5 WAR by even the most generous calculations. The biggest issue I have with WAR is that it just kind of sucks, especially for individual comparisons within seasons like this, and the most annoying aspect of it to me by far is that there’s no expression of uncertainty. Never in a million years should you provide point estimates from a statistical model without quantifying the uncertainty. It’s completely nonsensical, antithetical to statistical inference, and a good indicator that someone doesn’t know what they’re doing.
Regarding Judge and Ohtani, I checked this morning and saw these values:
| fWAR | bWAR | |
|---|---|---|
| Ohtani | 9.3 | 9.2 |
| Judge | 11.0 | 10.6 |
If you believe the estimates produced in the Open WAR paper I posted–which is reasonable because it’s written by highly-qualified academic statisticians and their results aren’t extremely different from fWAR or bWAR–then one of the major takeaways is that the uncertainty in WAR values is relatively large. That’s illustrated nicely in this density plot and table of quantile estimates for the 2012 season below:
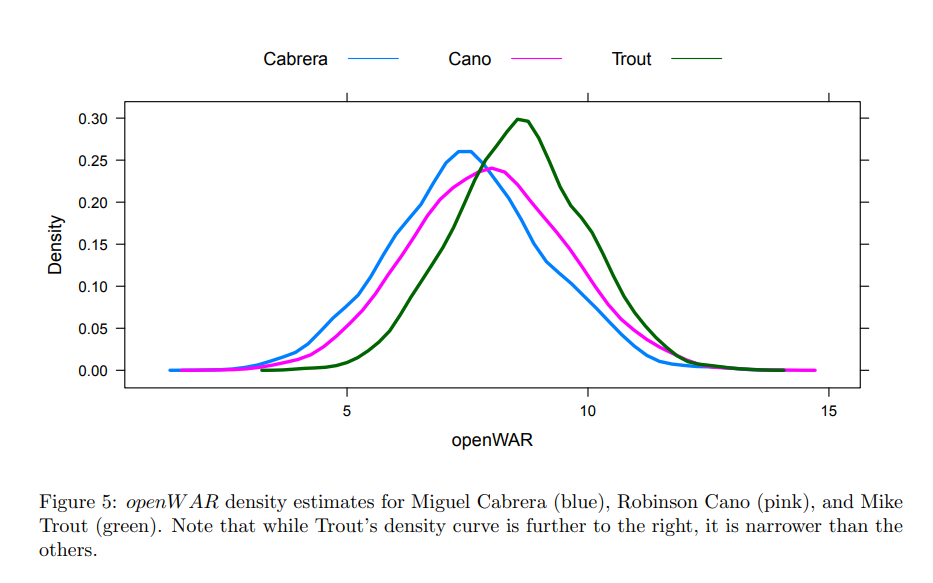
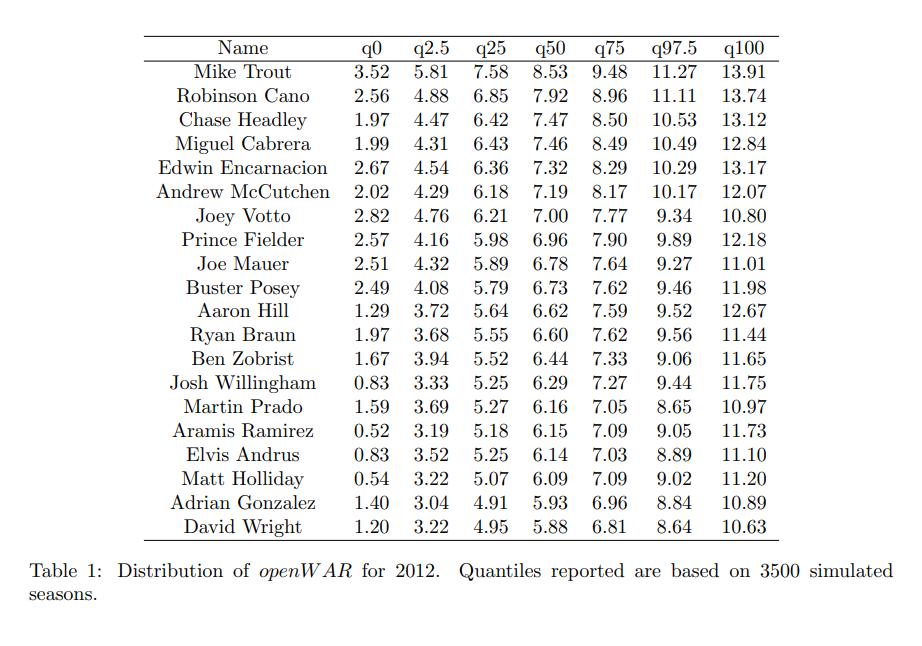
The most jarring thing here is the amount of uncertainty. Mike Trout’s 95% confidence interval is (5.81, 13.91) for a median openWAR value of 8.53. He’s more than a full win better than Miggy, so how confident should we be that he actually had the better season? They simulate that with resampling:
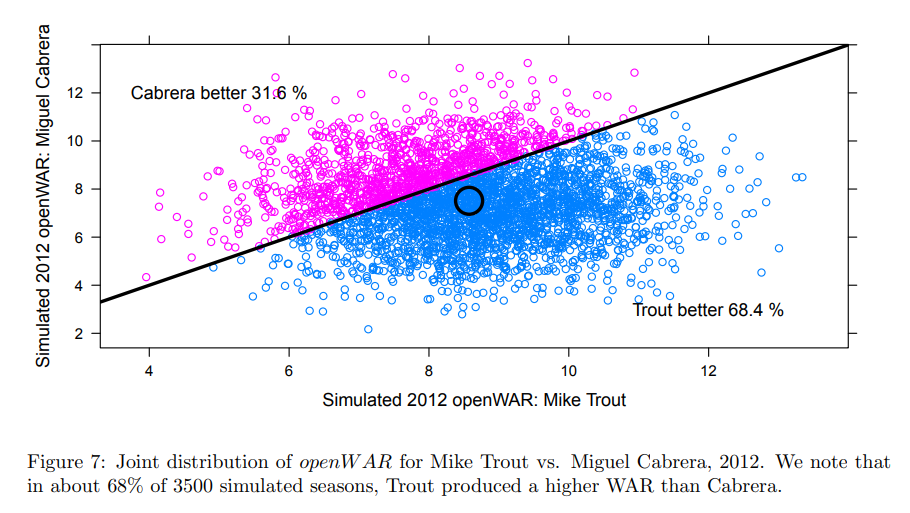
So while the odds are in favor of Trout having the better season, it’s only slightly better than 2:1 under this model. I’ll note that it doesn’t come anywhere near the level of certainty required for scientific evidence, but you could make a strong case that we don’t need such a high bar for baseball. Also note that this isn’t accounting for the uncertainty arising from properties of the estimators: oWAR puts 2012 Trout at about 8.5 WAR, but that’s roughly 1.5 and 2.0 WAR less than fWAR and bWAR, respectively. Sometimes these things are just gonna give significantly different answers for the same player.
That’s why I’ve made the point that WAR’s performance on average isn’t necessarily meaningful given how it tends to be used, and that tendency is to directly compare individual outlier players within seasons like Judge and Ohtani. For example, I’ve seen many fWAR and bWAR stans reporting HiGh cOrReLaTiOnS tO TeAm WiNs of, say, 0.88, and it’s a complete nothingburger. At its core, WAR is just a fancy run differential model, so of course it should correlate highly to wins at the team level when you add it all up. Who cares? Pythagorean expectation is better at this and far simpler to calculate because that’s what it’s designed to do. For “best player” comparisons, I’m simply concerned about how much they miss by on the best players, because whether they get all of the 0.2 WAR role players correct doesn’t matter. For example, 2017 Votto rates as 6.1 fWAR (#13 overall) and 8.1 bWAR (#1 overall). That’s a substantial difference in both WAR and rank order.
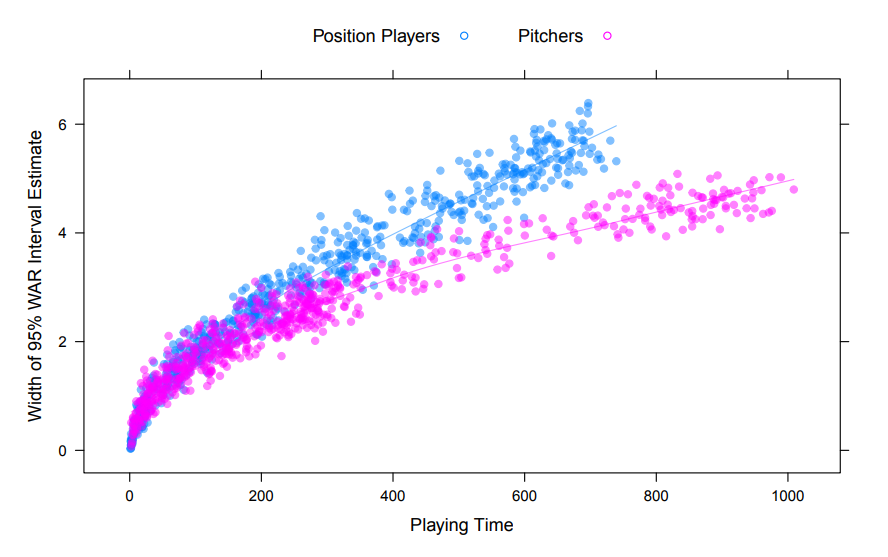
While I’m in the weeds, I’ll point out another idiosyncratic aspect of WAR unearthed by this paper, and it’s that variance estimates for pitchers and position players aren’t equal, and it’s not exactly clear why this is happening or how it may affect comparisons:
In general, the confidence intervals for pitchers tend to be smaller than those for position players with comparable playing time. This may suggest that pitchers perform more consistently across plate appearances, or merely reflect the fact that the replacement level for pitchers is higher (closer to 0) than it is for position players.
If I had to bet on one of their two explanations, I’d probably go with the first one. One thing I immediately thought of is that platoon splits take much longer to stabilize for hitters than for pitchers.
I think the evidence for this is solid and not disputed. That seems to indicate there’s considerably more randomness in hitter outcomes, so if we’re just looking at outliers in any given year, it’s going to be less likely that a pitcher rides variance to the top of the WAR leaderboards. In that case, pitcher vs. position player WAR may not be an apples to apples comparison. With respect to the second point, it’s not clear to me that replacement level pitching and hitting are isometric comparisons. What they’re proposing may be true, but why? I’ve read several pieces suggesting that the way replacement level is defined tends to overestimate the quality of replacement level pitchers.
5 Likes