Sometimes I take a step back and am just astounded by all this. It’s unreal. Like, even though I’ve had years to internalize how this country has become a joke in many ways, there’s still part of me that doesn’t want to believe it.
18 Likes
Do you think the virus realizes this? Cause that’s the only way that mutation is any more likely to take hold right now. Are you attributing strategic intelligence to the virus?
1 Like
It’s stunningly stupid.
This is the problem with the modern GOP. The herd is calling the shots. They are occasionally steered one way or another, but the seething masses of deplorables on Facebook are really driving the bus. The “leaders” are just trying to keep up.
Ergo, they are literally incapable of any sort of real sacrifice, listening to reason, or digesting complex situations.
3 Likes
Yes, and that’s all my original post about the topic ever actually said. That we were drawing live, and perhaps more live than before because of the pandemic.
I think the miscommunication here is that you’re talking about “right now” and I’m talking about what would happen over the long sweep of evolutionary time. But no, evolution doesn’t need intelligence to have viruses evolve clever countermeasures to host responses. MRSA didn’t “know” we were going to come at it with antibiotics.
So, apparently the “Salute to America” fireworks display on the National Mall is still happening on July 4th. Most DC folk are smart enough to stay away from the Mall on the 4th, but I wonder if (a) we’ll still get a tourist wave and (b) how many people with access to rooftops or other prime viewing spots throw their traditional viewing parties?
If you want to go to an infinite time scale. We are taking fall.
Grunching as well.
The reason that many of the viruses that have been around for a long time are less lethal is because WE evolved.
The bulk of evolutionary pressure over the last 7000 years has been disease related.
2 Likes
It’s not going to react to something until we do it. Or, like, it will have some other strains that have mutated and if we end the other 99% of active strains (which are one or two current variations) with a vaccine, the others will not have competition.
Now, if you’re talking about 1,000 years from now, that’s fine. But, like, that change hasn’t started happening based on current conditions, nor do I think anyone right now really cares about that part of it.
Jim Acosta on CNN just now in a packaged report… “But that’s not quite true, as a surprising spike in coronavirus cases is spreading…”
Surprising spike… lol.
1 Like
Mask rate roughly 90%.
Those not wearing a mask were almost all Boomers or old Gen Xers, most of whom were overweight. The one exception to this was a 25-30 year old woman who was probably 6’ tall and weighed about 350.
2 Likes
I agree. Like I said before I’m not saying any of this is going to help us at all in the near term.
NYC supposed to go to phase 3 on Monday July 6
This will allow indoor dining and “personal care” businesses to resume with reduced capacity
I’m reading a book related to this topic. Essentially (re)understanding evolution as an immunological event/process. (I am not a scientist so pardon if my one sentence synopsis isn’t perfect)
The Microcosm Within: Evolution and Extinction in the Hologenome. By William Miller
2 Likes
Is the United States of America a first world country?
- Yes
- No
0 voters


I voted No, but we’re not second world (socialist), and we’re not third world or worse. We’re like some new class of rich, but democratically flawed and societally instable nation. We’re… USA#1.
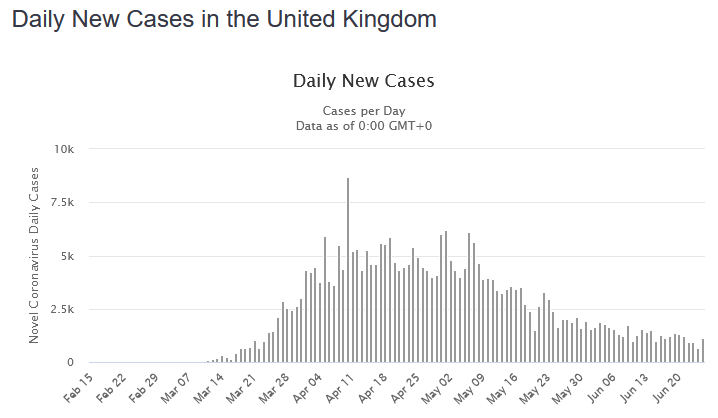
Is any other 1st world country fucking up this badly? Even the UK is showing a recovery instead of a plateau like the US.
1 Like
There are a lot of people on here compiling data and doing analysis, so I’ll join the fray with another perspective. Based on the types of data people on here are collecting, it might be worth it to create a dumping site on google sheets. I’m fairly sure I’m the only one doing the type of analysis I’ll describe below, and I can make all of my data available to people on here to do their own analysis of it, if interested.
One of the things I’ve seen asked quite a few times on here is why Florida, Texas, and Georgia managed to escape really bad numbers at the beginning of the pandemic, despite having absolute idiots as governors. As Dan can probably attest, I felt like I had ‘discovered’ the answer in something called the Social Distancing Index score (SDI) that is being tracked at https://data.covid.umd.edu/
In all three of those places, based on SDI performance, the people listened to the health experts and ignored their terrible governors. Even though all three of them issued statewide orders horrifically late, people in their states had basically voluntarily locked down significantly ahead of the governors. The problem is when it came to re-opening, many appeared to listen to Trump and their dumb governors over the health experts. That’s created the reckoning we’re facing and I believe the SDI numbers bear that out.
The only real problem with the data (and there is a lot of it that’s useful on that site) is that it tends to lag 2-5 days depending on the day of the week. It also has to be grabbed manually instead of off a spreadsheet like covidtracking. As of right now, it’s only updated to June 22. The good thing about that lag is that it’s not meaningful anymore due to the relatively widespread re-openings. They’ve all been going on long enough that it’s fairly easy to tell the cat’s out of the bag and is going to be exceptionally difficult to get back in.
I’m not generally interested in the prediction side of this, but have been very interested in trends to see what’s appearing to be working and what isn’t. Every time, I come back to the SDI. I feel like nearly everything going on right now could be analyzed at three levels and probably get pretty close with trend modeling. Those three pieces are new cases, SDI, and R0. I don’t know how they interact with each other in a way that can make a formula, but SDI and R0 are very likely creating conditions in some of the best performing places that in some ways don’t seem to make sense (Rhode Island, Delaware, Connecticut, Massachusetts, and Michigan).
I don’t have time to drop all the graphs on here right now, but one of the things I was trying to accomplish was graphing the correlation between SDI and case rise and/or fall. It previously had been nearly impossible in my skill set due to the small SDI numbers and large case numbers. Dan showed me a graph a few weeks ago that demonstrated the look I was going for but was far too noisy with too much data to be useful. When I saw some of goofy’s graphs, I knew it was possible to make something that would work. I reached out to a friend and with trial and error we figured out both the graph type and what kind of data it needed to have in it to show the effect I was looking for.
I’ve been compiling daily SDI since March 11 for 51 places and had always found behavior was making the data too messy to be super useful. The lowest SDI always consistently occurred on Mon-Thu. Fridays always had the single worst day SDI, but it didn’t fall apart everywhere all at once. Sometimes places would ‘cheat’ on a Friday but get back to good SDI every other day of the week (at the daily level, I think this was why Illinois continued to grow in cases despite having high weekly average SDI). Uniformly, throughout the country, SDI was high on the weekends. I built what I felt were reasonable SDI guesses of case surges in nearly 20 places, many of which ultimately seemed to be correct or within a day.
When coming up with the graphs yesterday, I realized this level of detail was likely a mistake, and went back to the weekly SDI average. In every case I’ve looked at so far of the roughly 12 highest caseloads right now, I think the generalized SDI (localities have wildly different SDI as a data point) gave me the results I most expect to see. 14 days after falling below what I perceive to be the target SDI, I see the surge in cases beginning. In a place like NY, the ‘surge’ is a slowing of the drop. I haven’t done a thorough analysis of the graphs yet, so will need a bit more time to make some guesses about what might happen.
That said, as much as I hate to say it, I think many of the biggest hot spot places are essentially ‘done’ until a vaccine. In the best performing places that are high density population, it seems pretty clear to me that it takes at least 10-12 weeks above the target SDI to not get a nearly ‘immediate’ big rise in new cases once the place has fallen below their target SDI. In a place like NY it might take 14 weeks above the target SDI, which is similar to what I think has happened. I don’t think there are any places that have had any significant amount of cases that can fall below their target SDI in fewer than 8 weeks and still have any degree of success. At this point, we’re now over 4 weeks removed from Memorial Day weekend, the weekend nearly every place in the country first dropped below their target SDI. I doubt a single place that’s dropped below its target SDI is back above it as of the 6/17-6/23 measurement period (a few are inching back up toward it).
By looking at some of the hardest hit places early in the pandemic, it took about 4 weeks of being significantly above the target SDI just to begin slowing it down. That was with only one week of time below the target SDI as spread began. We’re at four weeks now, minimum, almost everywhere and almost every place in the country has more active cases now than when that last week of poor SDI happened (3/11-3/17). If it took 10-12 weeks to start flattening the curve after only one week of bad SDI in hard hit places, I can’t even imagine how many weeks it will take to get back to that flattening after this failed re-opening experiment. My preliminary guess is January, if we get back above target SDI in most places right now (it will probably be at least another week before that happens), but I really hope I’m wrong.
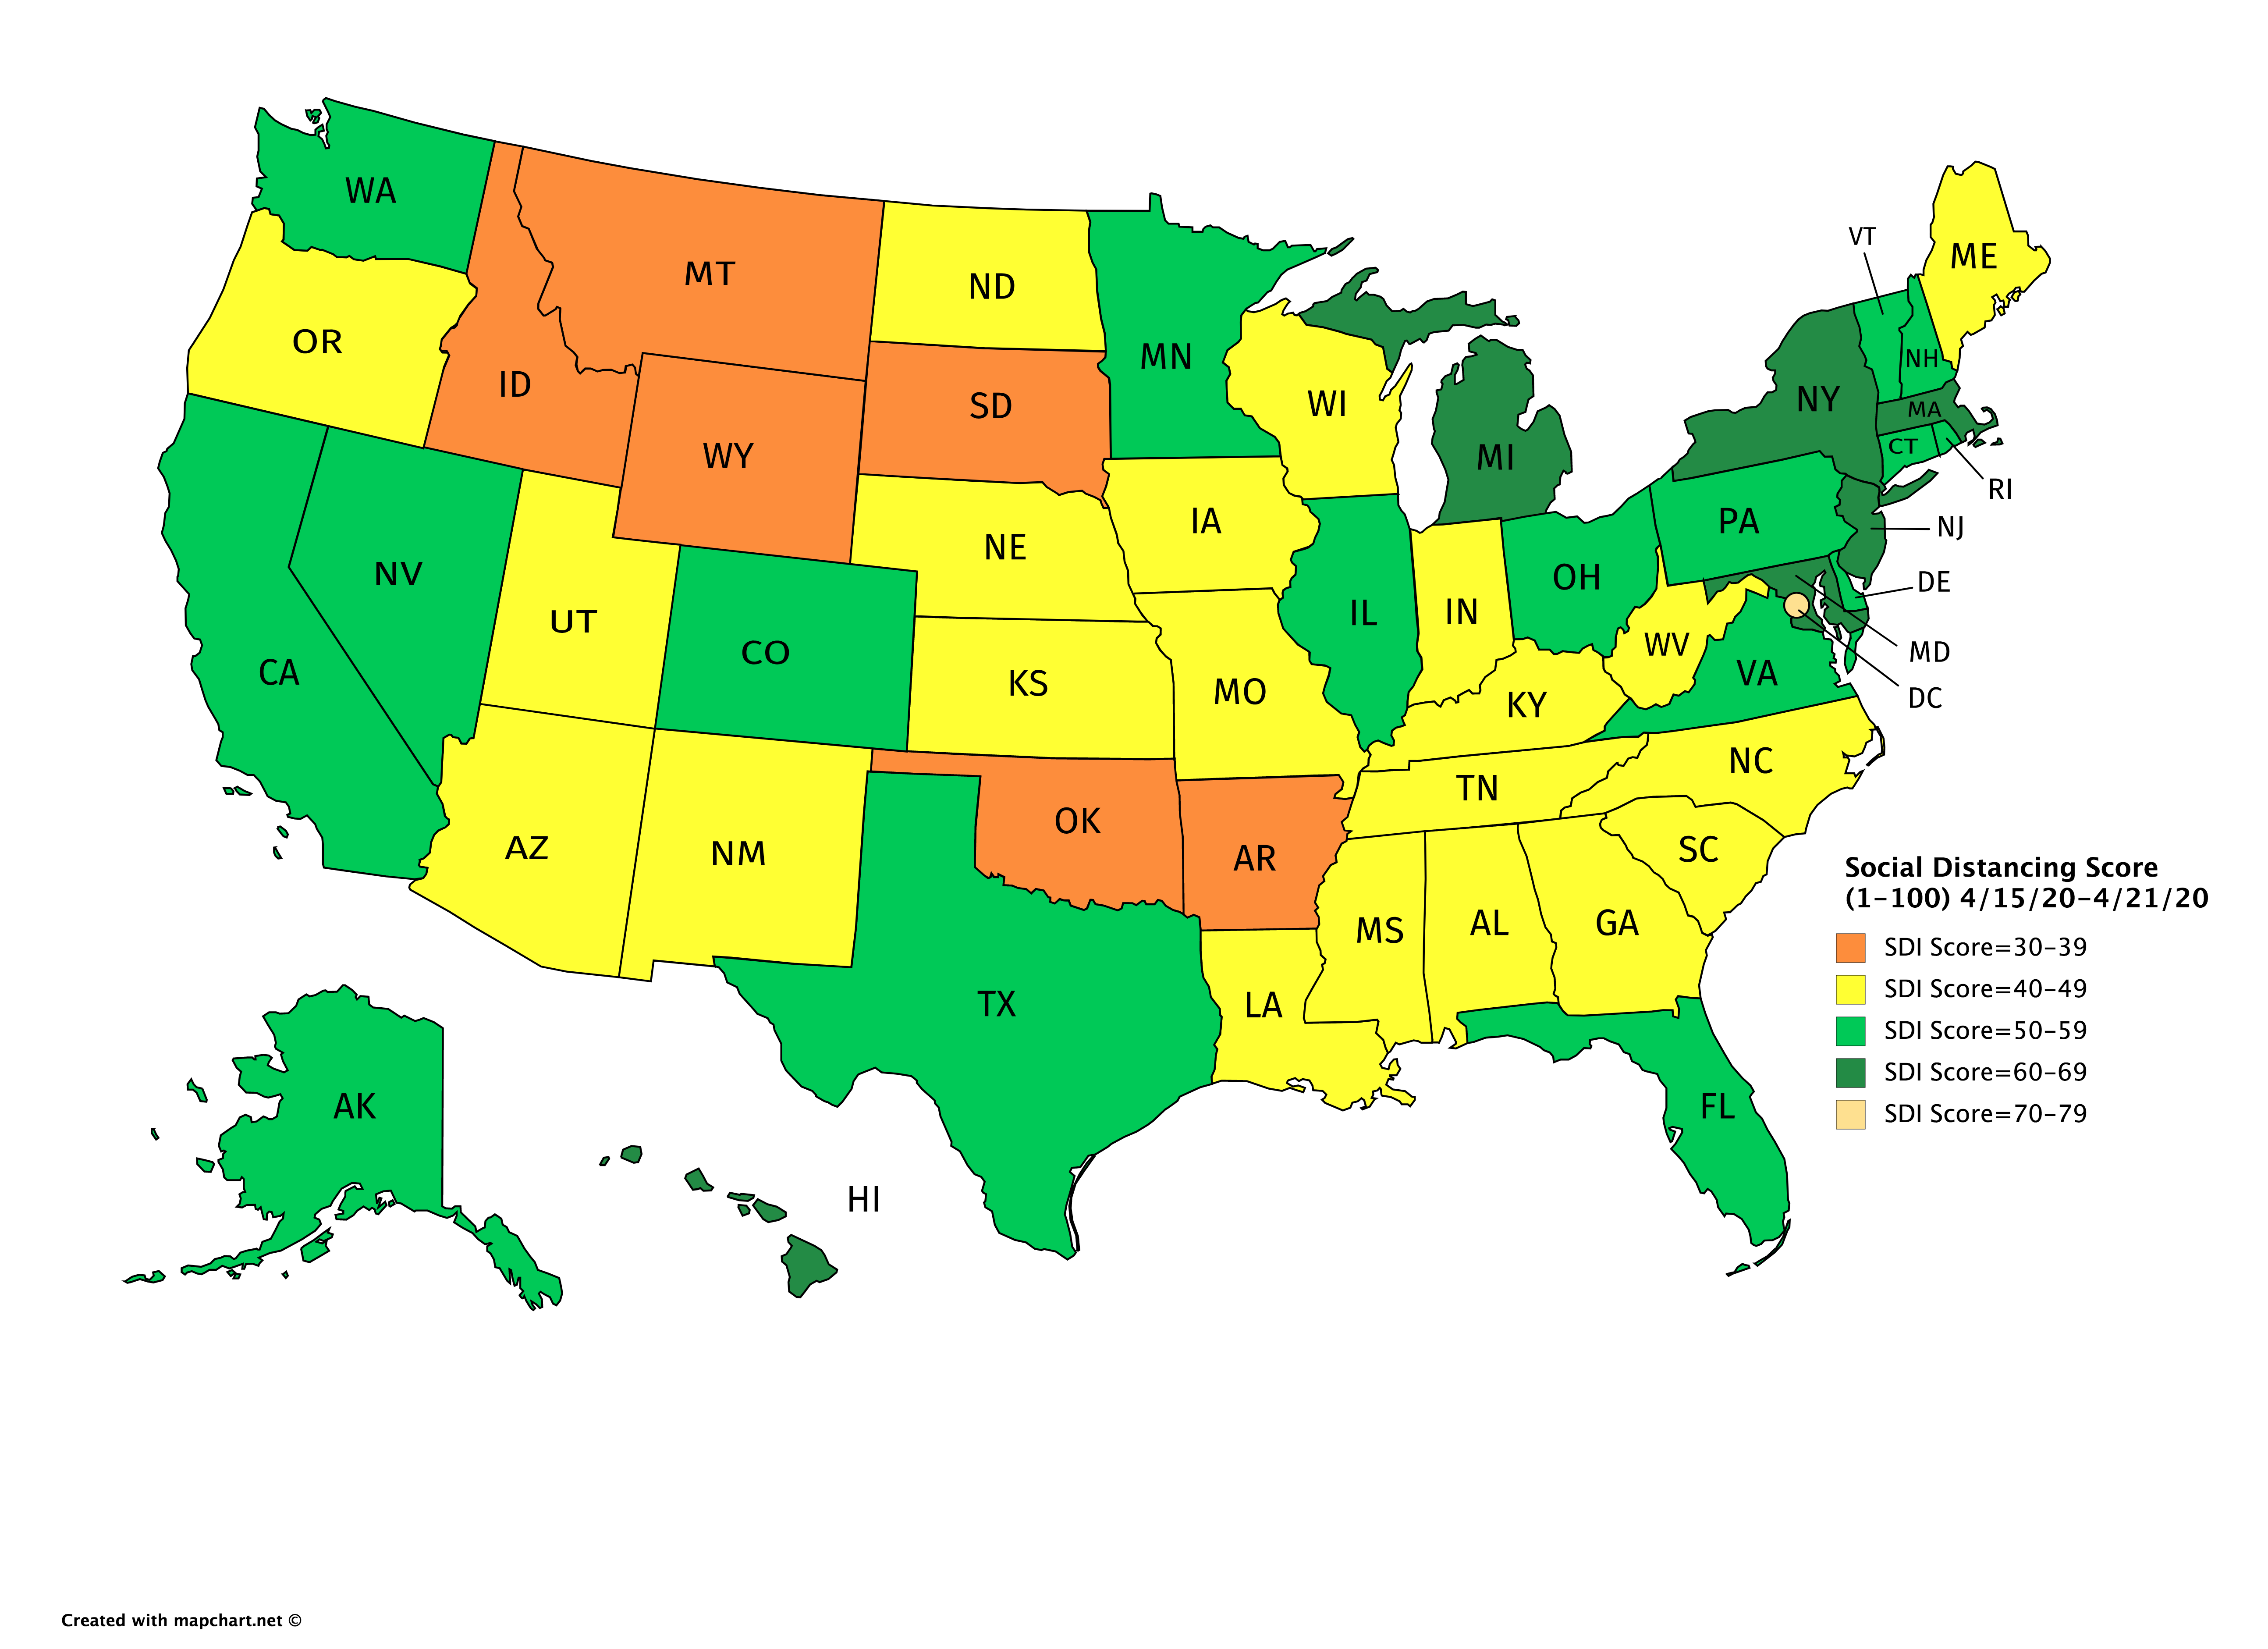
To close out this post, I want to show the effect of the asshole Trump without getting into the specifics of how many people he’s straight murdered in the pandemic. My original perception of the target SDI for the country to begin having success as a whole was 40+ SDI. It took nearly a month to get there, but the country did it. Every single state was above 40 SDI. The next week Dumb Donny started being a crybaby about opening up and liberating stuff. There has not been a single instance of every state in the country having 40+ SDI since. These two maps show that immediate effect:
SDI Map 4/8-4/14:
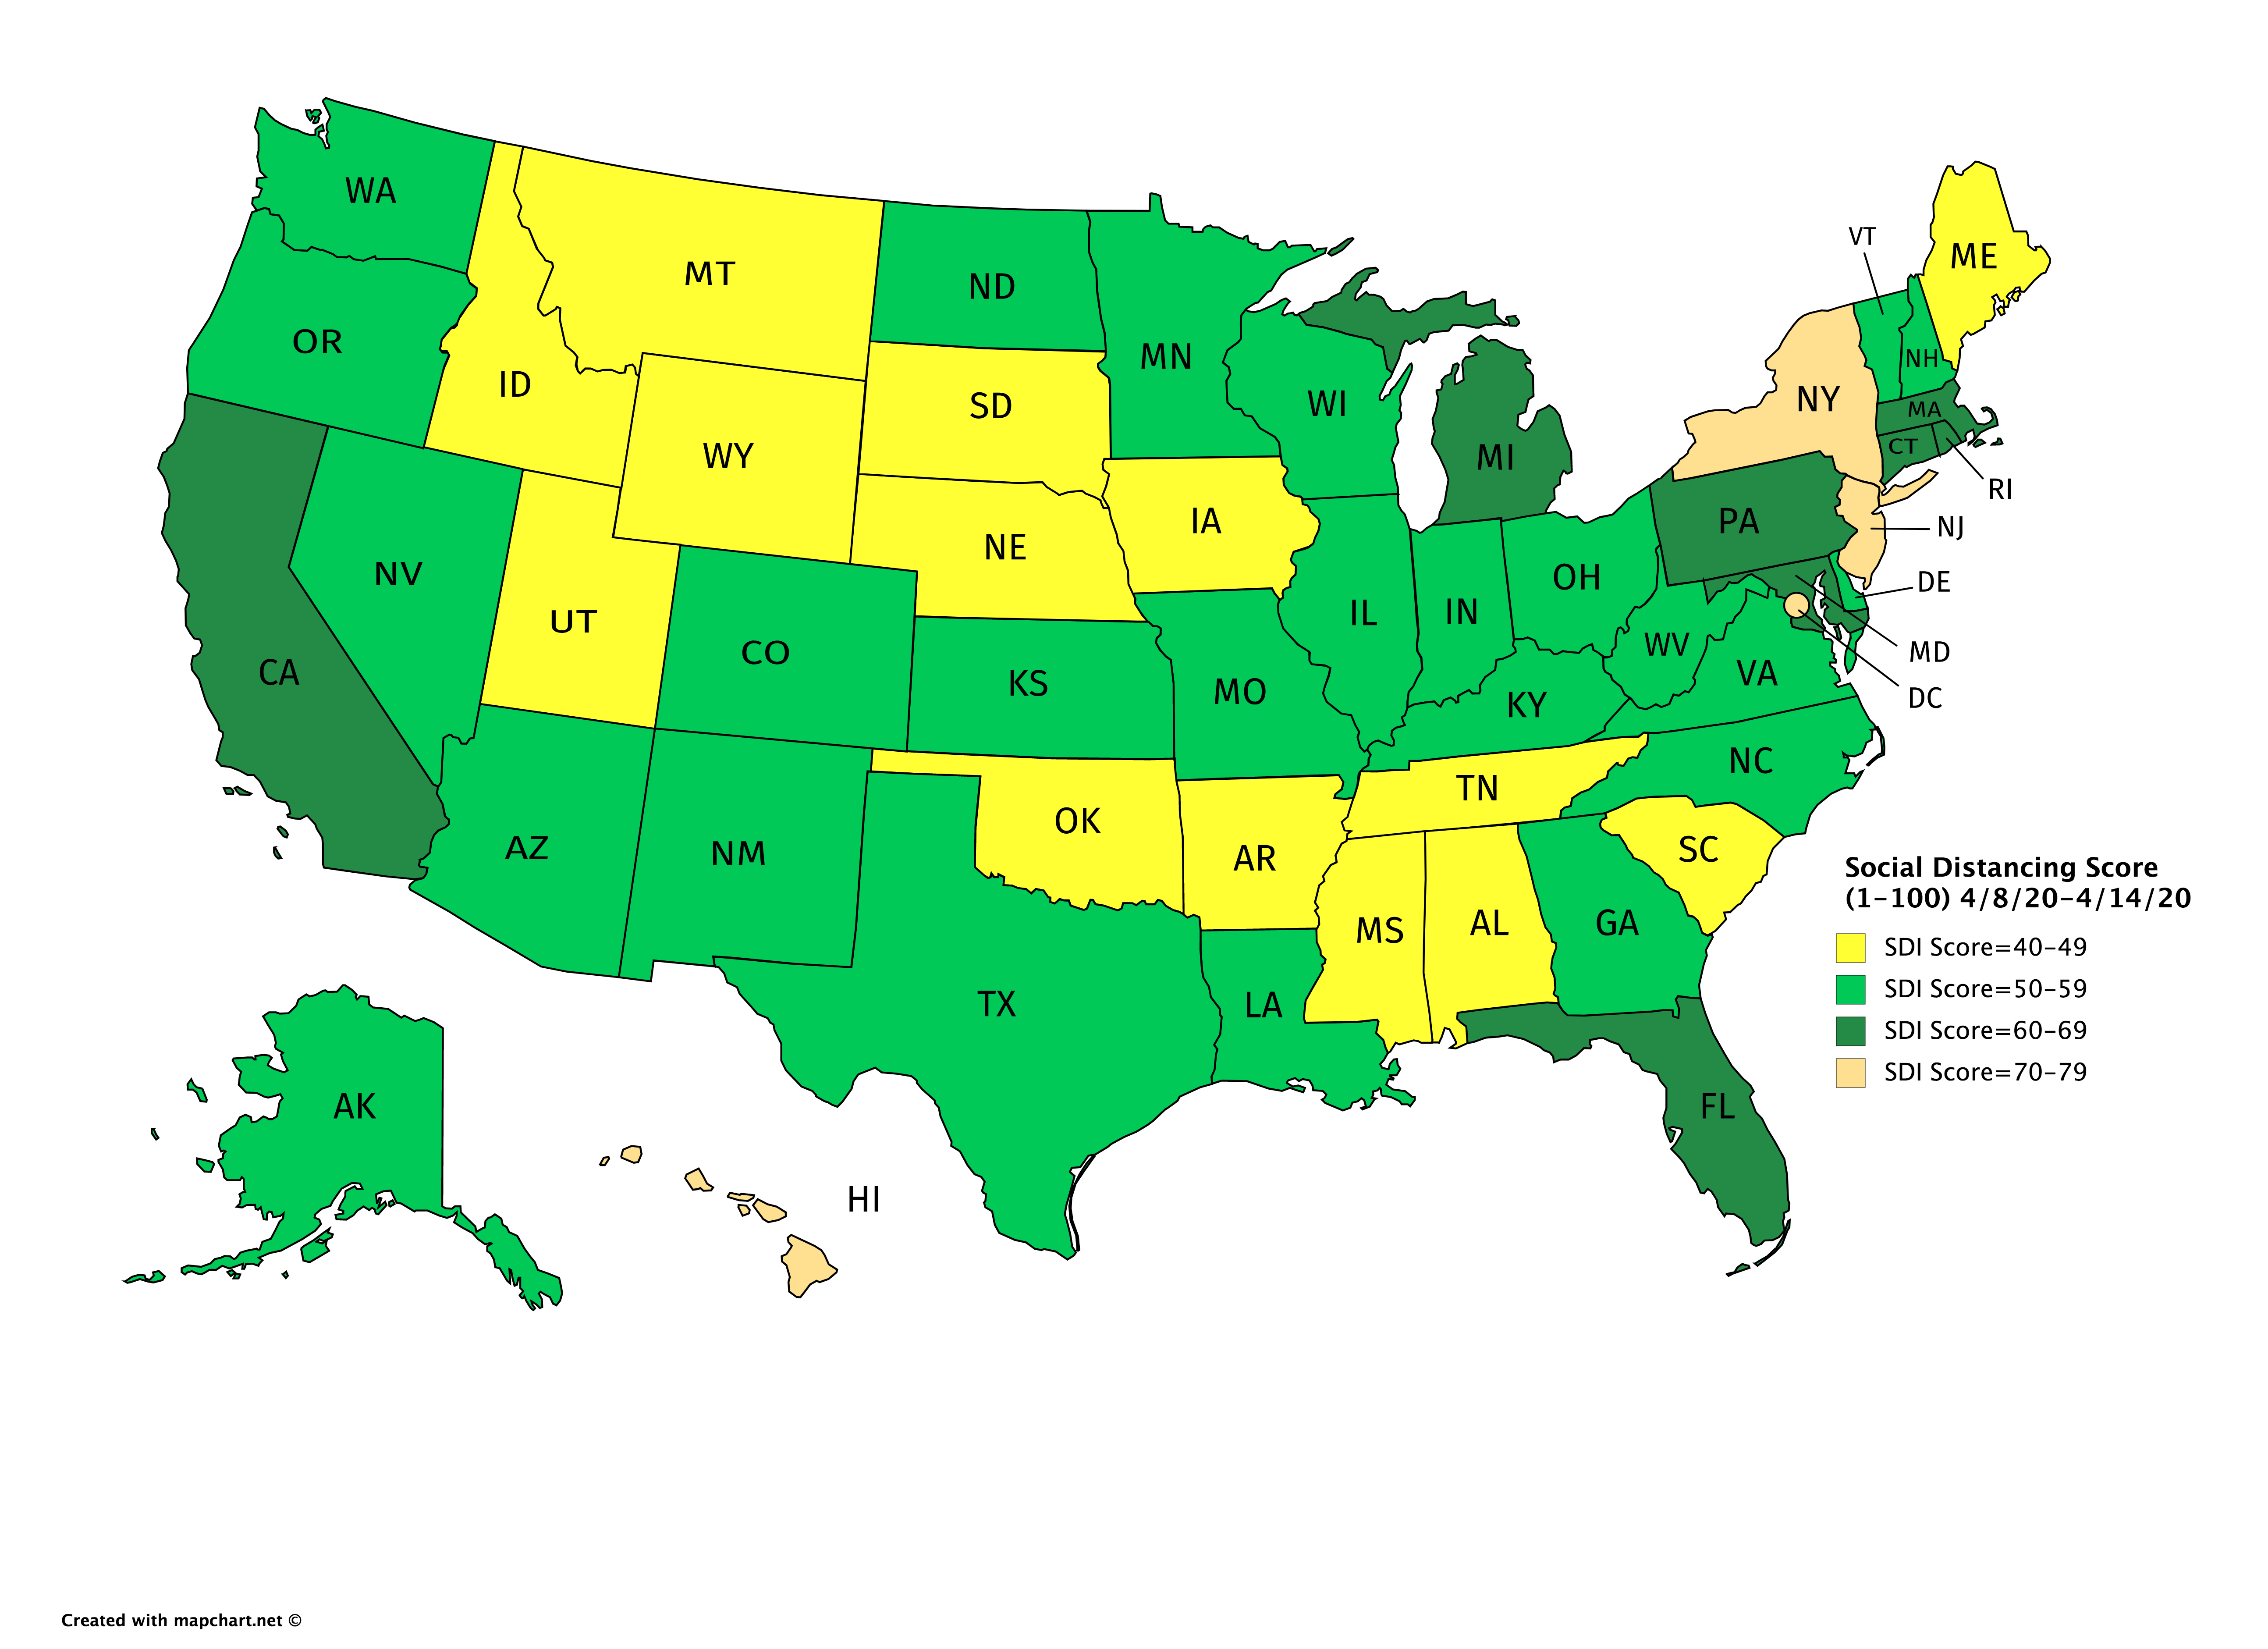
This is what the map looked like the following week.
SDI Map 4/15-4/21:
Now that the basic methodology has been explained, I’ll make one more post with 12 graphs in it without much text. Most of the graphs are the worst current weekly caseloads or trends, but there are a few also in there to demonstrate what good SDI work looks like (in my opinion, if overall SDI remains high and active cases relatively low, protests would not have had a big effect on new cases especially with good masking practices). I’ll eventually post all 51 (SDI isn’t tracked in Puerto Rico), but it’s unlikely that will happen until tomorrow.
18 Likes
The total number of individuals tested yesterday statewide was 6,969 (not including antibody tests) and the percent positive was 18.3%.
SC numbers are in and they’re bad. New record high, but just barely. Hospitalizations up, but at a lower clip than we’ve seen.
The number of tests seems to be at capacity and it seems to me like we aren’t going to be able to even measure further spread. We have seen positive percent go from 3% to 18% but not a substantial increase in testing to go along with it. What that tells me is that there’s going to be a cap on how many cases S.C. can measure and report per area, which means this could be more prevalent than we expect.
The silver lining is that hospitalizations are increasing slowly still and there are more than two open beds for each reported hospitalization in the state which gives us time to get things under control