Technical WAR Discussion Part III
I’m going to jump straight into the calculation for Ohtani’s 2022 batting fWAR. Here’s the equation:
WAR = (Batting Runs + Base Running Runs + Fielding Runs + Positional Adjustment + League Adjustment + Replacement Runs) / (Runs Per Win)
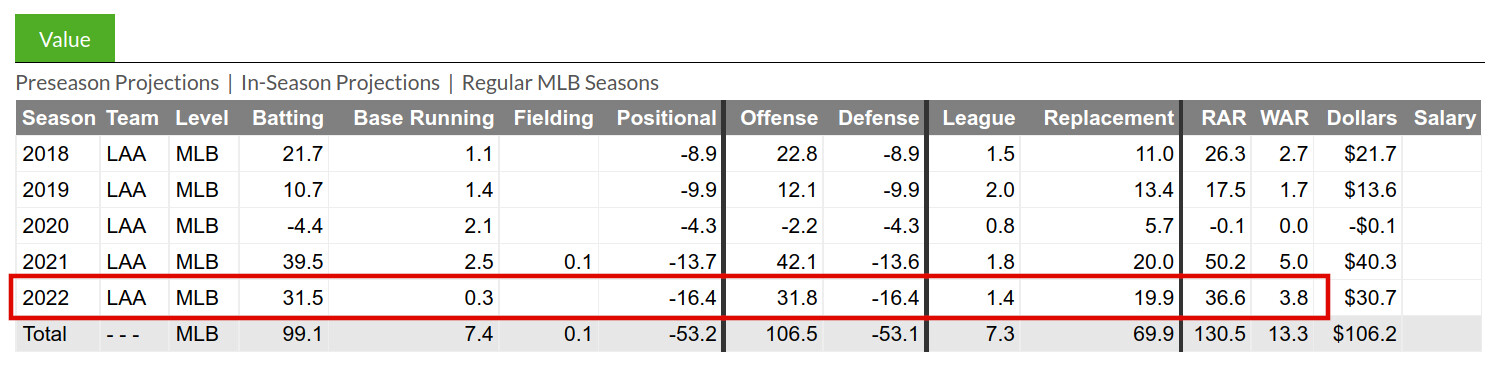
You find these in the Value section of a player page:
So first calculate runs above replacement (RAR) then divide by the runs per win (R/W) constant to get WAR. Remember, the base currency of WAR is just runs, and wins are calculated by applying a constant. That constant is 9.524 and can be found under Season Constants in the Guts! section.
RAR = 31.5 + 0.3 + 0.0 + (-16.4) + 1.4 + 19.9
RAR = 36.6 (rounded)
WAR = 36.6 / 9.524
WAR = 3.8
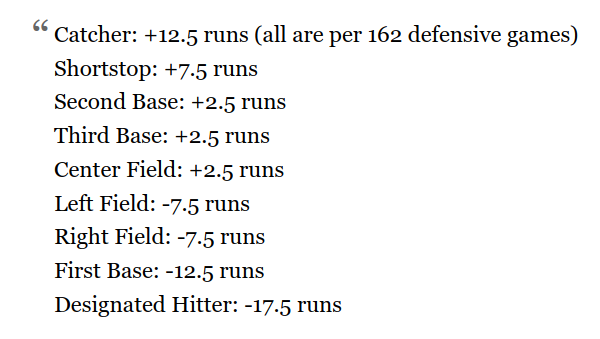
You might notice the large -16.4 “positional adjustment” that decreases his total hitting WAR by 1.72. That’s the adjustment for DH:
In essence, the positional adjustment is a correction to account for the fact that different positions are more challenging than others, which is a pretty easy thing to accept.
Instead of mealy-mouthed explanations for metrics, can they not just post precise definitions? FG and BR are bad for this. Like, write it in a way that’s concise and someone can reproduce it.
For position players, the largest point of contention comes in measuring defense and estimating the positional adjustment.

I can accept that some positions are more difficult to play. What doesn’t make any sense to me is why someone would introduce a “positional adjustment” to offense to account for that. This is a major component of WAR given that a catcher and DH are separated by more than 3 fWAR right off the top, so I’m definitely not just going to take someone’s word for it. Where do these numbers even come from?
The values used for the position adjustments we use currently come from this thread at the old Inside The Book blog. In the end, the following values were agreed upon and are the ones used by our sister site, FanGraphs:

Ah, THE BOOK. Of course. I remember it being so bad that I couldn’t finish it. It’s just dudes averaging numbers in spreadsheets (see that blog post). No use of common practice statistical or econometric methods. Certainly no reporting of diagnostics or standard errors.
I’m not going to go too deep on that blog post, but there are a few important things I want to point out. First, it appears that the entirety of the data is from 2002-2005 (?). That seems like a specifically bad time period to base anything on, not only due to steroids but also given the shift, pitching styles, and batted ball profiles dominating now. Second, the theory for assigning relative run differentials between positions is based on how players are used, not estimated directly. It would be like assuming bunting runners over is good because that’s what teams do. There’s a lot of assumption and fudge factor going on there, and when Fangraphs said this is a point of contention, they certainly meant it. You can find a number of articles from the past decade belaboring this point with more recent data, such as this one:
https://tht.fangraphs.com/re-examining-wars-defensive-spectrum/
The reason for the investigation is based on the actions of major league teams. They don’t value—or don’t seem to value — players the same way as do the writing and researching public.
Do these values need some tweaking? It has been a few years since these were established, and it’s always good to refresh our research, even if nothing really changes.
You can read the article if you want, but I’ll cut to the heart of the matter: more recent data suggests these adjustments are askew, especially the DH value (multiple investigators have shown this).
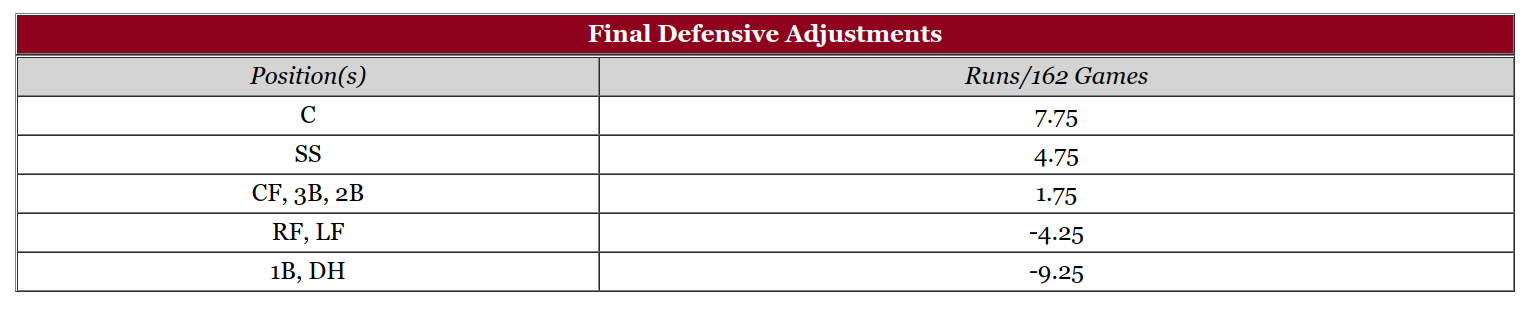
The biggest change I can see is a shrinking of the range. The order stays the same, but players don’t get as much credit for playing harder positions. Now with all the rest of the positions done, it is time to finally move to the most controversial adjustment — the designated hitter.
So then he goes through a laborious task of averaging the averages (sigh) and arrives at these updated values, and his DH value is chosen somewhat arbitrarily b/c of course it is:
I’m a little uneasy saying this, but I would put the DH on par with first base in terms of value, as the defensive adjustment and DH hitter penalty offset each other. The DH penalty (8.4 runs) is more than one standard deviation (eight runs) from the mean. This method gives the DH a below average defensive rating, but then takes into account how hard it is for hitters to move to the DH position.
The argument here is that DH doesn’t play defense, but the data oddly suggest that it’s more difficult to hit as DH than as a fielder. This DH penalty still exists even if you account for injured players who are using it to avoid the field. Anyway, if you add his new DH estimate to the the estimated value of an extra roster spot, that comes out to about an additional 1 WAR in Ohtani’s case. That’s pretty significant for the most talented unicorn baseball player ever.
Another busted assumption about DH that others have noticed is that the imaginary AAA replacement DH who’s available in abundance doesn’t seem to exist in practice. One third of MLB teams posted negative WAR from the DH position in 2022, more than any other position. Only 16 DH players qualified, three of which posted negative WAR, but this is misleading because only three accumulated the 502 PA as DH: Ohtani, Nelson Cruz, and J.D. Martinez.
This circles back to my point about replacement level at DH for Ohtani. Who is the replacement? It has to be multiple players because there aren’t more than a handful of dudes getting full reps at DH. In reality, you probably need the equivalent of at least three players to replace the volume, but that requires roster spots that this thought experiment doesn’t afford. So can I then just platoon some imaginary players with extreme splits and devalue the position even more? If you look at the 2022 Angels’ team stats, their next men up were already playing and posting negative WAR.
Also, the claim that WAR is context neutral and allows you to compare players between years, leagues, and teams is clearly false. It’s easy to set up a hypothetical where Ohtani produces higher WAR under legacy NL rules taking only about 1/3rd of the total PAs. The same player playing an objectively worse season and yet viewed more favorably by WAR due to rules changes outside the player’s control. How is that free of context? It’s not a great metric for comparing players. I’d argue its only use should be in GM / team strategy, but even then it’s so outdated I’d never use it over a simulation.