Interesting. This is a case where I don’t want the choice. I don’t have any knowledge at all about these vaccines, and I don’t want the stress of trying to determine whether one is better for me than the other. Just shoot me up and kick me out the door without even telling me which one you gave me.
yeah I can’t really imagine preferring one over the other given that I don’t know anything about the specifics of either of them, I’m just going to get the jab wherever I can get it first and I’ll take whatever they have.
Met the mother in law halfway for our COVID masked outside Christmas exchange in the Panera parking lot. Went surprisingly well actually… she cried when we left but my wife held it together like a champ.
The AstraZeneca results were just wonky enough that I’d prefer Pfizer or Moderna all else being equal, but there’s not much of a difference in the effectiveness data between the latter two.
Cloth when I’m working hard gets soaked and I’ll go through half a dozen in a day. Not as bad now that its winter and the buildings are cold and I’m not working as hard. But yeah those don’t work to well with some of the things I have to do.
I’m a little confused by what this paper is saying. Do I have this correct?
They did a regression analysis to estimate the parameters for a model where the impact of school format is dependent on the square of the existing case rate.
The model was not significantly predictive on their data. (I.e., cannot reject the null that parameters are equal to zero)
However, if you assume that there is a relationship and that the model parameters equal their point estimates, the model would predict a significant difference at largely out-of-sample values of case rates with very high confidence.
Is that a correct understanding? If not, what am I missing?
I think it’s relative rate of increase giving a positive slope to schools.
Cases low: a 10% community increase is a 10% increase in schools (give or take)
Cases are high a 10% comm increase is more than a 10% school increase
Then the last point, what was high in the paper is considered low now, my a multiplier. So basically with today’s case load the community impact on schools is extreme.
I think of it this way
When case loads are below some threshold there may not even by contagious people in the school or at least not in every classroom. At some point of community spread the certainty of most if not all rooms having one or multiple positives becomes a near certainty. And with long exposure times of sitting in the same place with the same infecteds for hours really challenges the effectiveness of mitigation measures.
It would likely have a curve shape similar to michaelis-menton kinetics used to describe enzymatic reactions.
That’s insane. Gf got tested yesterday, results back today. She’s negative. I’m still sick, nothing major. Sporadic coughs, low energy and I’m stuffed up, but I’ve made 6k or so playing online poker this week.
My quarantine is up in 2 days, but I doubt I’ll be symptom free by then.
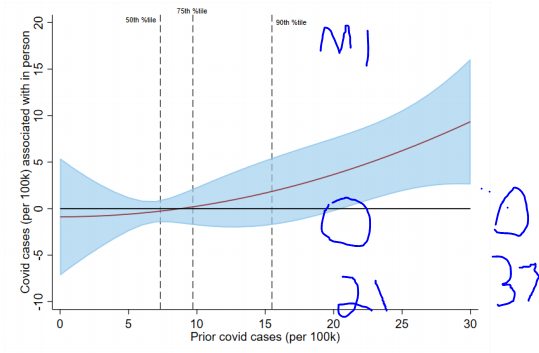
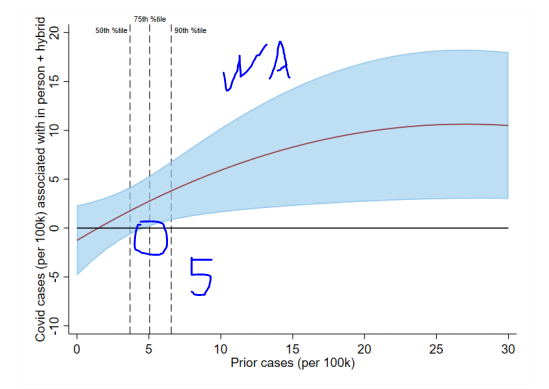
I think my question was a little more specific. I’m pretty certain that the case rate cutoffs that they cite are derived from these charts:
(pp 45 and 46).
And the red line in those charts is the output of their regression model at the given case rate. Which would make the blue area some sort of error band around the model output. What I was trying to understand is how the blue area is determined. It seems that it must somehow be derived from the error in the model parameters, not from particular subsets of the data, but that’s far beyond my statistical knowledge.
Regarding the model, I think the analogy to Michaelis-Menten is not apt. They are modelling the change in COVID cases as a function of the square of the prior-period case rate (see Equation 7 on p.18), which is super-exponential growth.
Although looking further, Table 2 on p 42 has the actual model parameters. For in-person instruction in Michigan, they estimate that the change in new cases is 0.001 * x + 0.01 * x^2. For hybrid set-ups, it’s 0.659 * x - 0.015 * x^2. Then in Washington they lump in-person and hybrid together, and calculate that the impact is 0.881 * x - 0.016 * x^2. (This is why the Washington graph starts to turn downward on the right–the model predicts that in-person schooling reduces infections at very high case rates.)
My niece is home from the military. She’s having a party tonight with 15 or so people in a small apartment. No masks. No social distancing. 3 of those attendees are going to a Christmas eve party at my brothers. About 25-30 will attend, no masks. 6 of those people will attend the family get together on Christmas that I was scheduled to attend.
Several, at least 6-7 have/had serious health issues or 70+ years old. No one will be wearing a mask or social distancing. I’m sure this kind of gathering is going to be repeated everywhere. But, it wont be my fault if they get the Covid.
Your regular Chiefsplanet update. Imagine how many 100s of 1000s of these are going on right now across the country.
Costa Rica update: Airport was empty. I sat in seat 1A in first class and they blocked off seat 1B. It’s possible I got pozzed by the two women behind me or the one across from me. But it was a redeye so everyone just slept the 5.5 hours - no eating or yapping. Got to hear the pilot explain to the flight attendant how we’ve always had viruses and this one isn’t special.
Everything has been outside, it’s hot and humid, very breezy. My only real concern is my traveling companion caught it sky diving or something right before I got there and is now blasting me in the car. A couple more days and we should be mostly in the clear on that.
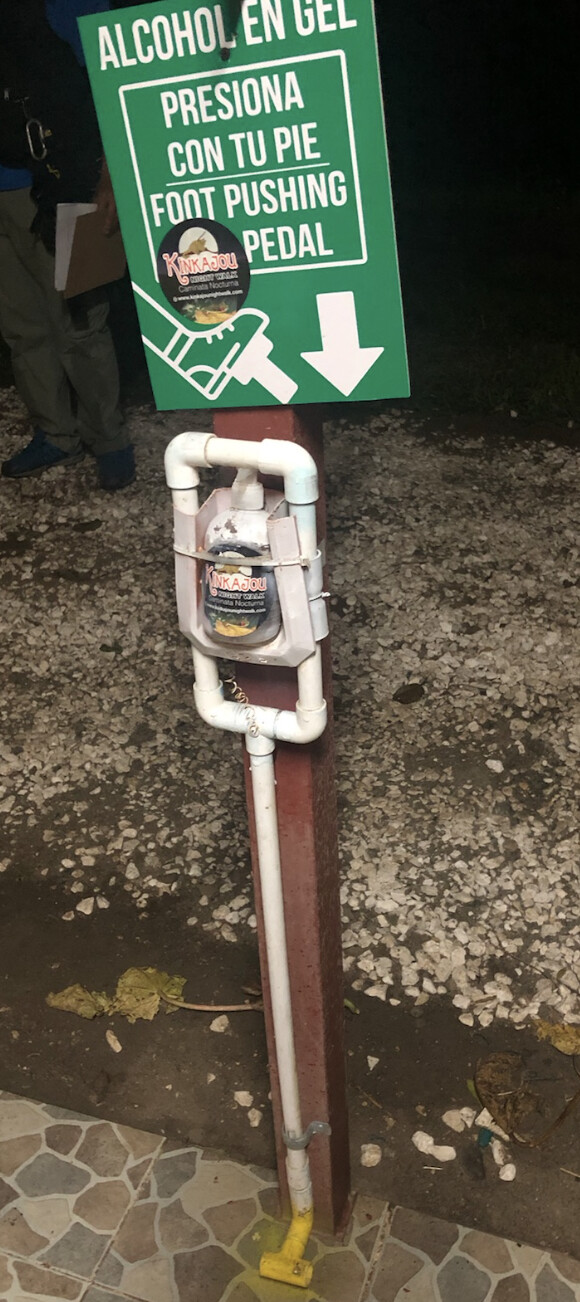
As far as Costa Rica, everyone wears masks indoors and outdoors on the street - even in the podunk towns we drive through. They check your temperature (lol) before doing just about anything. They take the social distancing 6’ apart rule very seriously. Also they have foot operated sinks and hand sanitizer everywhere.