COVID-19: Chapter 4 - OPEN FOR BUSINESS

This seems like wishful thinking and I’d be surprised to see it hold up to much scrutiny. What I won’t be surprised is to hear the general public use this as an excuse to further dismiss covid as a threat.

Couldn’t this theory be easily disproven by the fact that about 0.35% of NY’s population died from covid? Or by broader random sampling antibody testing?

This echo wave concept is going to be real but it’s not going to appear as a separate wave. It’s just going to keep going up, until we take steps to mitigate it. It’ll just be that the people catching it at the beginning of this step-wave skew younger, and the people in the second or third generations of infections are more vulnerable.

There is something to the idea that antibody studies are undercounting - due to something like 30% of people never producing antibodies. But they’d be off by a factor of double at the absolute most - not 10x.

Also no one knows how long someone has immunity if they do or don’t develop antibodies. But presumably the non-antibody people could catch it again sooner.

The dream scenario if we really luckbox it is that some percentage of the population has natural immunity without producing antibodies - their T-cells can kill it or something. If this percentage was like 25-30%, and the immunity for those who got it in the first wave was lasting, you’d really be somewhere in places that had a really bad wave, and the cap on the worst case scenario would be a little worse than half of what we think it is now.

But, like, there’s no real indication of this being the case… and even if natural immunity via t-cells is a thing, who knows whether it’s in 1% of the population or 50%, and odds are it’s going to be toward the lower end.

Anyway, if there’s a dream, that’s it I think.

1 Like

lol I clicked through to Ethical Skeptic’s blog. The guy is a complete crank. I recommend reading the “Who is The Ethical Skeptic?” section here, it’s pretty funny.

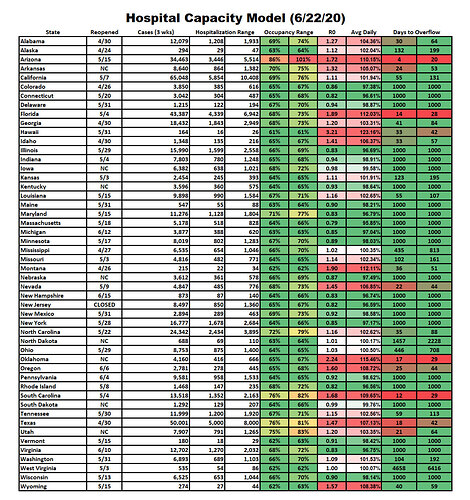
States I’ve been watching…

Arizona: No major change, which is a good thing, but I went in and checked and that’s 3.77 rounding up to 4. I’m guessing the 4 yesterday was 4.xx rounding down. I should say that the fact that no major change is a good thing tells you just how fucked they are IMO. They’re on a death march, but they didn’t start into a dead sprint yet.

South Carolina: A slight decrease in R0 buys them a day. Is it noise or the beginning of a trend? Most likely noise, but at least it’s a glimmer of hope for a state that could still avoid the worst case scenario… barely.

Florida: R0 is up to 1.89 from 1.8, days remaining outpace their trend just slightly. Not good. Orlando has an R0 of 4.2, which is absurd. If you go with the rolling 7 days instead of 14, it’s “only” 2.4. The actual number is probably in between. Seems like a good time to point out that the current R0 is dependent on current behaviors, and what we’re really doing here is estimating what the R0 has averaged the last two weeks and assuming it’ll be similar going forward. At R0=4.2, based on their own hospital capacity data as of yesterday (86% full), and based on a low end estimate of 10% of positive tests over the last 21 days currently being hospitalized, they have 3.8 days to full capacity in Orange County (Orlando). If you give them the 2.4 R0, they are 6.2 days away. Keep in mind that on that timeline, the hospitalizations that drive them over the threshold will come from people who were infected at least a few days ago. Orlando is in dire need of surged capacity, either through getting non-covid patients out or adding more beds. Their ICU capacity is at about 75%, but this may even be worse. Keep in mind of the 86% of beds full, only about 1 in 10 of those is COVID. So the 8% keeps growing and when it hits 22% (8+14), that’s when you’ve hit capacity. I’m guessing it’s more like 1 in 3 cases in the ICU that are COVID, but that’s a total guess.

Even if I’m way off on Orlando, they need to hit a parlay: I’m wrong on my assumptions about hospitalization rate AND that R0 is closer to 1 now. Otherwise they need to surge capacity and they still will be in a world of trouble.

Oklahoma: Speaking of dead sprints, their R0 is up to 2.24, so that’s trending in an even worse direction. 17-29 days to tipover, and a week to 10 days away from a bunch of Trump rally covid cases in all likelihood.

Texas: Also picking up speed, up to 1.47 and losing two extra days off the front end and five extra off the back end. It’s unacceptable, and it seems like that’s just going to have to be accepted. (Abbott reference.)

Nevada: Loses one extra day off the front, three extra days off the back, slightly worse R0.

Idaho, Kansas, Montana and Wyoming are in danger of joining this list soon.

Hawaii: Slight improvement, I expect them to make a big leap in the right direction at the end of the week in the Thursday or Friday update.

Oregon: Shout to Oregon, they pretty much ramped it up and shut it back down right before it got to be out of control. They gain a few more days of life, and their R0 dips to 1.60. I expect this trend to continue. This is a pretty good example of reopening, failing to keep the R0 < 1, and course correcting.

Houston only adds 179 new cases today, according to the data I’m seeing. This is Sunday’s data, though, and the Sunday lull seems to be a thing there. As a result, their R0 is essentially unchanged. They are 16 days from overflow, which keeps them on the same track. The bad news is, their tipover date still ticked off one despite an expansion in beds available to COVID-19. I believe they are beginning to scale back non-COVID hospitalizations in order to surge capacity for COVID. You would hope that expansion would push the date out, but no such luck.

Either Abbott’s a complete moron or he knows exactly how far he can scale these capacities and is waiting until the last possible minute to do a shutdown. Either way, with exponential growth at play, a gambling event is occurring in Texas.
10 Likes

I went through the PSU study in reasonable detail and I think their error is they constructed a pretty finely-tuned model based on NYC-specific information, then tried to apply it to the whole US.

Their supplemental tables are illuminating, and can be found below. Especially Figure S4 which is the money shot of the whole study.

https://stm.sciencemag.org/content/scitransmed/suppl/2020/06/22/scitranslmed.abc1126.DC1/abc1126_SM.pdf

My hunch is their model has value for about half a dozen states. But beyond that, it’s unfortunately trash.

95% confidence that >3% of Missouri’s population had COVID 19 in March but less then 0% of Arkansas’s did? ND and SD’s confidence intervals for infection rate barely even overlap?

There’s a ton of noise in an extremely messy source data set (emergency room surveillance across all 50 states) and they’re trying to cherry pick a time when they know something exceptional was happening and attributing all the noise during that time to the exceptional thing.

imo this doesn’t change our narrative understanding of COVID at all. It wasn’t spreading across the states in checkerboard fashion infecting 2-5% in some and 0-1% in others with no apparent geographic pattern. Which is what it takes to average them all together and say 8.7 million cases with a very tight confidence interval.

I almost wish these people could run studies by UP for some pre-non-peer review. Kudos for uploading the entire report though!

4 Likes

They are wearing masks. Masks appear to really work.

I stole this reply and posted it on Reddit as this is on the front page of r/science. You want me to credit you? UPBRO TheNewT50?

Very small errors or differences in the way each state counts beds would have a huge impact when the numbers are so low.

https://twitter.com/pbump/status/1275266520264949761?s=21

2 Likes

lol, no need for credit. Someone better positioned than me should go over all this too.

I’m not a statistician or anything of the like, but there seems to be a fair degree of possible malpractice here.

Their test case is NY, which has by far the most complete picture of hospitalizations in March because, you know, that’s where the horrendous outbreak was. So they develop a confidence interval based on what looks like a very rigorous process, and lo and behold, it matches the serology results.

But to take that input and then apply it to all other states and state the same confidence interval is madness. Like, the fact that this is telling you that the likes of South Carolina, Tennessee, and Missouri had outbreaks 30-50% as bad as NYC did is not an interesting, noteworthy result ready for publication. It’s an indication of serious flaws in methodology. I mean, we have excess mortality statistics. Those didn’t go away. And they demonstrate quite conclusively that states like South Carolina didn’t have 100-200k cases in March.

Then it’s even more ridiculous to take those clearly flawed outcomes, which they admit are based on a patchwork of incomplete data that has to be generalized and expanded across broad populations, and then try to backwards project them through the life of the illness. Like, why? Isn’t your result already shocking (or, more probably, dubious) enough?

1 Like

Also our stats, data, and science bros dont get nearly enough love. Shower them with hearts and chocolate and virtual butt touches

14 Likes

That tickles. But Don’t stop.

Very very early in my career I was working with Lactobacillus strains as part of a technology donation to my little non profit.

The strains had been evaluated for how well they made lactic acid in the presence of a high concentration of lactic acid.

Say they started with 90 g/L and strain A ended at 98 and strain B ended at 100. So that made the conclusion that B>A by 25%. B made 10 and A made 8. 10/8=1.25.

However I looked at the data and said bullshit

The analytical was at best +/- 2% (which is pretty good actually) So the equation is really

100 +/-2 minus 90 +/-1.8= 10+/-2.7
98 +/-1.96 minus 90 +/-1.8=8+/-2.67

Which is a pretty massive overlay of error bars and they only did each strain once.

So remember kids if you ever subtract two large numbers to get a small number there is a shitton of error and if you ever divide a big number by a very small number there is a fuckton of error (basically the Ped State paper).

6 Likes

And high pitch Ron will easily win re election in 2022 because useless jackass FL Dems refuse to vote in midterm elections

2 Likes

Shocking. Who would have thunk after a packed tennis match and night out partying.

3 Likes

Djokovic is also a new age alt medicine anti vaxxer type so he probably tried to immunize himself from Covid by eliminating gluten in his diet or something like that.

5 Likes

He’s an antivaxxer too.

You might be able to square the two ideas by pointing to NY’s policy mistake of sending COVID patients into nursing homes. If the IFR in the broad population is low, but New York infected ~all of their elderly, that could produce a much higher death rate.